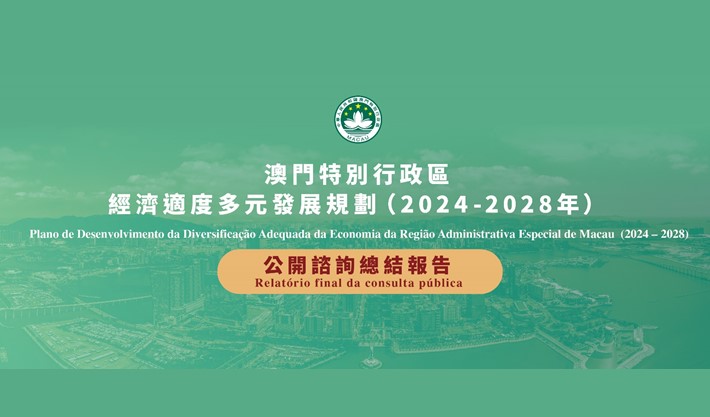
|
MAIN ECONOMIC INDICATORS |
|
|
1999 |
2000 |
2001 |
2002 |
2003 |
|
Population as of December 31 (1000s) |
429.6 |
431.5 |
436.7 |
441.6 |
444.0(e) |
|
Nominal GDP (US$mn) |
6,133.9 |
6,197.6 |
6,206.8 |
6,730.9 |
1.820(c) |
|
Nominal GDP (US$mn) |
14,351 |
14,394 |
14,298 |
15,355 |
n.a. |
|
Real GDP growth (%) |
-3.0 |
4.6 |
2.2 |
9.5 |
16.5(c) |
|
Unemployment rate (average) |
6.4 |
6.8 |
6.4 |
6.3 |
6.3 (d) |
|
Inflation C.P.I. growth (%) (a) |
-3.2 |
-1.6 |
-2.0 |
-2.6 |
-1.4 (e) |
|
Exports of goods, f.o.b. (US$mn) |
2,194.0 |
2,530.2 |
2,291.5 |
2,347.6 |
904.0 (f) |
|
Imports of goods, c.i.f.(US$mn) |
2,034.4 |
2,246.8 |
2,377.9 |
2,521.0 |
1,023.1 (f) |
|
Trade Balance (US$mn) |
159.6 |
283.4 |
-86.4 |
-173.4 |
-119.1 (f) |
|
Balance of Current Accounts (US$mn) (b) |
1,638.50 |
2,177.0 |
2,251.3 |
2,634.1 (d) |
n.a. |
|
Pataca Exchange Rate (1US$=) |
7.992 |
8.026 |
8.034 |
8.033 |
8.033 (g) |
(a) Starting from January 2001, the Consumer Price Index series is based on the period October
1999-Sep2000
(b) Net exports of goods and services (based on GDP estimates)
(c) Provisional data: First Quarter of 2003
(d) Mar - May 2003
(e) Jan - June 2003
(f) Jan - May 2003
(f) Jan - Apr 2003
n.a. Not available
< Top >
|
MONETARY INDICATORS |
|
(Million USD, at end of period) |
December
2000 2001 2002 |
April
2002 2003 |
April
% Change
02/03 |
|
Money Supply (M2)
of which
Currency in circulation
Demand and Saving Deposits
Quasi Monetary Liabilities (a) |
10,580 11,369 12,319
214 236 256
402 500 535
9,964 10,659 11,529 |
11,735 12,479
240 266
498 518
10,997 11,694 |
6.3
10.8
4.4
6.3 |
|
Loans and other credit to residents (b)
Public Sector
Firms and Individuals |
4,858 4,514 4,269
26 23 24
4,832 4,491 4,245 |
4,362 4,215
23 25
4,339 4,190 |
(3.4)
5.7
(3.4) |
|
Net Foreign Assets
AMCM
Other Financial Institutions |
9,342 10,608 12,195
3,818 4,161 4,529
5,523 6,447 7,666 |
11,218 12,639
4,244 4,879
6,974 7,760 |
12.7
14.9
10.8
|
(a) This aggregate consists of saving deposits, notice deposits, time deposits, and certificate of deposits
(b) Credit granted by the AMCM and other financial Institutions
< Top >
|
MACAO'S IMPORTS BY SECTORS AND MARKETS |
|
Million USD |
2001 2002 2002 2003
Jan - May Jan - Ma |
Growth rate (%)
01/02 02/03
Jan - May |
Structure
02/03
Jan - May |
|
By End-Use Categories
Consumer Goods
Raw-materials and Semimanufactures
Capital Goods
Fuels and Lubricants |
781.0 901.6 337.1 382.9
1,102.8 1,090.3 426.4 445.4
308.0 347.4 152.2 119.8
186.1 181.6 63.3 74.9 |
15.4 13.6
(1.1) 4.5
12.8 (21.3)
(2.4) 18.4 |
37.4
43.5
11.7
7.3 |
|
Total |
2,377.9 2,521.0 979.0 1,023.1 |
6.0 4.5 |
100.0 |
|
Main Markets
Asia-Pacific
Mainland China
Hong Kong
Japan
Taiwan
E.U.
U.S.A |
1,953.6 2,082.3 795.5 836.4
1,012.8 1,051.5 388.2 427.6
330.0 366.6 147.7 143.3
129.2 170.0 63.2 83.6
158.5 168.4 60.5 62.6
299.2 297.0 120.3 126.2
98.8 104.5 50.7 43.4 |
6.6 5.1
3.8 10.2
11.1 (3.0)
31.6 32.2
6.2 3.4
(0.7) 4.9
5.7 (14.5) |
81.8
41.8
14.0
8.2
6.1
12.3
4.2
|
< Top >
|
MACAO'S EXPORTS BY SECTORS AND MARKETS |
|
Million USD |
2001 2002 2002 2003
Jan -May Jan - May |
Growth rate(%)
00/01 02/03
Jan - May |
Structure
02/03
Jan - May |
|
Main Sectors
Textiles and garments
Garments
Other Sectors
Toys
Electronics
Footwear |
1,923.1 1,970.4 670.4 737.3
1,637.6 1,632.2 534.4 602.0
368.3 377.2 153.2 166.7
0.9 0.6 0.1 0.3
19.7 16.2 6.5 9.2
80.1 83.9 34.4 35.0 |
2.5 10.0
(0.3) 12.6
2.4 8.8
(32.1) 129.6
(17.6) 41.7
4.8 1.7 |
81.6
66.6
18.4
0.0
1.0
3.9 |
|
Total |
2,291.4 2,347.6 823.6 904.0 |
2.4 9.8 |
100.0 |
|
Main Markets
North America
U.S.A
E.U
Asia-Pacific
Hong Kong
Mainland. China |
1,148.2 1,177.9 390.3 446.7
1,104.8 1,135.2 376.7 432.7
609.8 545.3 191.3 196.2
496.6 577.5 225.6 242.7
146.1 136.4 53.1 62.9
267.3 365.7 146.0 146.5 |
2.6 14.5
2.7 14.9
(10.6) 2.6
16.3 7.6
(6.6) 18.4
36.8 0.4 |
49.4
47.9
21.7
26.8
7.0
16.2
|
< Top >
|
BUSINESS INDICES OF MAJOR CITIES IN
THE PEARL RIVER DELTA |
|
|
Zhuhai
(2002) |
Guangzhou
(2002) |
Shenzhen
(2002) |
Macao
(2002) |
Hong Kong
(2002) |
|
G.D.P. (billion) |
US$5 |
US$36.3 |
US$27.1 |
US$6.7 |
US$161.5 |
|
Total Exports
F.O.B. (billon) |
US$5.7 |
US$13.8 |
US$46.5 |
US$2.3 |
US$20.1 |
|
Total Imports C.I.F |
US$7.6 |
US$14.7 |
US$40.6 |
US$2.5 |
US$20.9 |
|
Monthly Salaries
a. Management
b. Professionals
c. Workers |
US$605
US$362
US$97-US$121 |
US$725
US$483
US$85-US$158 |
US$362-US$1,571 US$266-US$1,087 US$109-US$423 |
US$1,595
US$1,807
US$387 |
US$1,599-US$2,604 US$1,421
| |