Pesquisar
MARKET BRIEFING –NEW ZEALAND
OVERALL ECONOMIC SITUATION
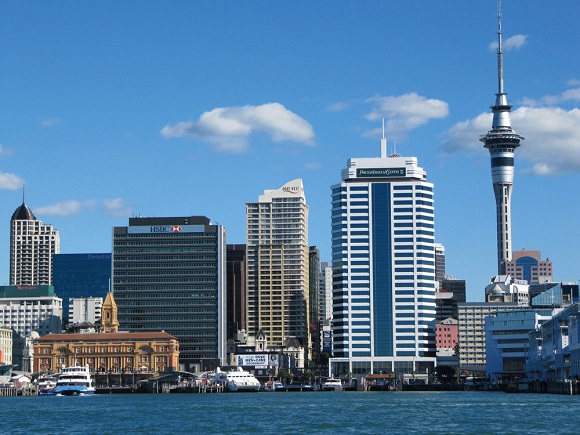
New Zealand is located in the south-western Pacific Ocean, 1,600 kms from Australia to the west across the Tasman Sea. It comprises of the North Island and the South Island with Cook Strait in between as well as a number of smaller islands. The country mainly focuses on agriculture and animal husbandry, with well developed service industry. Agriculture and animal husbandry exports amounted to half of the country’s total exports. It is the largest exporter of lamb and dairy products in the world and ranks second in wool exports worldwide.
BUSINESS OPPORTUNITIES
Industries
Major industries include agriculture, forestry and livestock farming products processing, including light industries such as dairy products, carpets, food products, leather, tobacco, paper making and timber processing. Products are mainly exported. Recently, heavy industries such as steel refining, oil refining, aluminium refining and the manufacturing of agricultural airplanes are being developed.
Agriculture
The agriculture industry is highly mechanical with major crops like wheat, barley, oats and fruit. The amount of food crops grown does not allow New Zealand to be self-sufficient and many need to be imported from Australia.
Forestry
Forest coverage amounts to 810 hectares with 630 hectares of natural forest and 180 plantation forest. Major exports include raw wood, paper pulp,paper and wooden board. Export markets are Australia, China, Indonesia, Japan, Korea, Chinese Taiwan and the US.
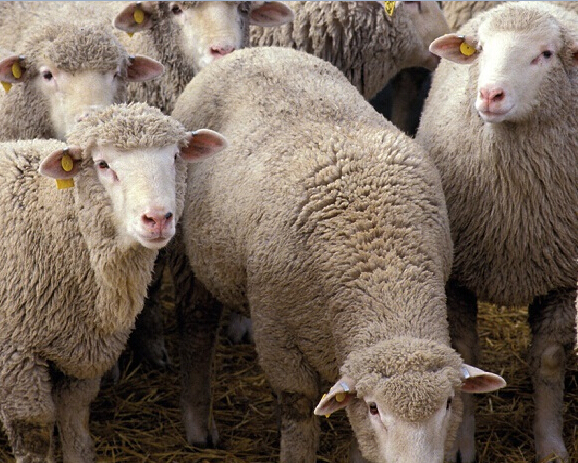
Livestock farming
The livestock farming industry is well developed covering 1,352 hectares, equivalent to half of the national total land area. Dairy products and meat production are the most important exports. Strong wool production ranks first worldwide accounting to 25% of the world’s production.
Fisheries
The country possesses abundant fisheries resources and the fourth largest Exclusive Economic Zone. The annual production of the economic zone includes fishery output of 500,000 tonnes, and around 600,000 to 650,000 tonnes of commercial fishing and cultured fish and shellfish, with over half of the products being exported.
Tourism
According to the data of Statistics New Zealand, over the 12-month period as of the end of July 2014, international tourists amounted to 2.8 million, showing a growth of 6% year on year. The top four countries of origin of tourists are Australia, China, the United Kingdom and the United States.
|
MAIN ECONOMIC INDICATORS 2013
|
|
| Gross Domestic Product (US$ billion) | 136 |
| Real GDP growth (%) | 2.5 |
| GDP per capita (US$) | 30,400 |
| Inflation (%) | 1.3 |
| Land area (sq km) | 267,710 |
| Population (Million) | 4.4 |
Source: CIA-The World Factbook, https://www.cia.gov/library/publications/the-world-factbook/geos/nz.html
FOREIGN TRADE FROM 2009 to 2013
|
Year
|
Total Trade
|
Exports
|
Imports
|
| 2013 | 75.19 | 37.84 | 37.35 |
| 2012 | 74.91 | 37.87 | 37.04 |
| 2011 | 73.01 | 37.54 | 35.53 |
| 2010 | 63.48 | 33.24 | 30.24 |
| 2009 | 49.3 | 25.35 | 23.95 |
Major Export Commodities: dairy products, meat, wood and wood products, fish, machinery
Main Import Commodities: machinery and equipment, vehicles, aircraft, petroleum, electronics, textiles, plastics
Source:
1.CIA-The World Factbook, https://www.cia.gov/library/publications/the-world-factbook/geos/nz.html
2.Index Mundi-Country Fact, http://www.indexmundi.com/new_zealand
| Main Destinations for Exports (2012) | % |
| Australia | 21.1 |
| China | 15 |
| US | 9.2 |
| Japan | 7 |
| Main Origin for Imports (2012) | % |
| China | 16.4 |
| Australia | 15.2 |
| US | 9.3 |
| Japan | 6.5 |
| Singapore | 4.8 |
| Germany | 4.4 |
Source:https://www.cia.gov/library/publications/the-world-factbook/geos/nz.html
MAINLAND CHINA –NEW ZEALAND
| Year | Total | Exports | Imports |
| Jan-Spet 2014 | 113.6 | 33.8 | 79.8 |
| 2013 | 123.9 | 41.3 | 82.5 |
| 2012 | 96.7 | 38.7 | 58.1 |
Source:
1.Ministry of Commerce of the People’s Republic of China, http://mds.mofcom.gov.cn/article/Nocategory/
MACAO- AUSTRALIA BILATERAL TRADE 2013
| Type of Trade | Weight (KG) | Patacas |
| Imports | 5,126,243 | 220,168,854 |
| Exports | 1,240 | 175,619 |
Source:The Statistics and Census Service, http://www.dsec.gov.mo/
SOURCE:
1. The Ministry of Foreign Affairs of the People’s Republic of Chinahttp://www.fmprc.gov.cn/chn/default.htm
2. The Ministry of Commerce of the People’s Republic of Chinahttp://zhs.mofcom.gov.cn/
3.The Economic and Commercial Counselor ’s Office of the Embassy of the People’s Republic of China in the New Zealandhttp://au.mofcom.gov.cn/
4. The Statistics and Census Servicehttp://www.dsec.gov.mo/
5. The World Factbookhttp://www.cia.gov/


</td><td>136</td></tr><tr><td>Real GDP growth (%)</td><td>2.5</td></tr><tr><td>GDP per capita (US$)</td><td>30,400</td></tr><tr><td>Inflation (%)</td><td>1.3</td></tr><tr><td>Land area (sq km)</td><td>267,710</td></tr><tr><td>Population (Million)</td><td>4.4</td></tr></table>
Source: CIA-The World Factbook, <a href="https://www.cia.gov/library/publications/the-world-factbook/geos/nz.html">https://www.cia.gov/library/publications/the-world-factbook/geos/nz.html</a>
<h3>FOREIGN TRADE FROM 2009 to 2013</h3><div style="text-align: right;">(unit: US$ Billion)</div><table ><tr><td><div style="text-align: left;"><strong>Year</strong></div></td><td><div style="text-align: left;"><strong>Total Trade</strong></div></td><td><div style="text-align: left;"><strong>Exports</strong></div></td><td><div style="text-align: left;"><strong>Imports</strong></div></td></tr><tr><td>2013</td><td>75.19</td><td>37.84</td><td>37.35</td></tr><tr><td>2012</td><td>74.91</td><td>37.87</td><td>37.04</td></tr><tr><td>2011</td><td>73.01</td><td>37.54</td><td>35.53</td></tr><tr><td>2010</td><td>63.48</td><td>33.24</td><td>30.24</td></tr><tr><td>2009</td><td>49.3</td><td>25.35</td><td>23.95</td></tr></table>
Major Export Commodities: dairy products, meat, wood and wood products, fish, machinery
Main Import Commodities: machinery and equipment, vehicles, aircraft, petroleum, electronics, textiles, plastics
Source:
1.CIA-The World Factbook, <a href="https://www.cia.gov/library/publications/the-world-factbook/geos/nz.html">https://www.cia.gov/library/publications/the-world-factbook/geos/nz.html</a>
2.Index Mundi-Country Fact, <a href="http://www.indexmundi.com/new_zealand">http://www.indexmundi.com/new_zealand</a>
<table ><tr><td><strong>Main Destinations for Exports (2012)</strong></td><td><strong>%</strong></td></tr><tr><td>Australia</td><td>21.1</td></tr><tr><td>China</td><td>15</td></tr><tr><td>US</td><td>9.2</td></tr><tr><td>Japan</td><td>7</td></tr></table>
<table ><tr><td><strong>Main Origin for Imports (2012)</strong></td><td><strong>%</strong></td></tr><tr><td>China</td><td>16.4</td></tr><tr><td>Australia</td><td>15.2</td></tr><tr><td>US</td><td>9.3</td></tr><tr><td>Japan
</td><td>6.5</td></tr><tr><td>Singapore</td><td>4.8</td></tr><tr><td>Germany</td><td>4.4</td></tr></table>
Source:https://www.cia.gov/library/publications/the-world-factbook/geos/nz.html
<h3>MAINLAND CHINA –NEW ZEALAND</h3><div style="text-align: right;">(US$100 million)</div><table ><tr><td><strong>Year</strong></td><td><strong>Total</strong></td><td><strong>Exports</strong></td><td><strong>Imports</strong></td></tr><tr><td>Jan-Spet 2014</td><td>113.6</td><td>33.8</td><td>79.8</td></tr><tr><td>2013</td><td>123.9</td><td>41.3</td><td>82.5</td></tr><tr><td>2012</td><td>96.7</td><td>38.7</td><td>58.1</td></tr></table>
Source:
1.Ministry of Commerce of the People’s Republic of China, <a href="http://mds.mofcom.gov.cn/article/Nocategory/">http://mds.mofcom.gov.cn/article/Nocategory/</a><h3>
MACAO- AUSTRALIA BILATERAL TRADE 2013</h3><table ><tr><td><strong>Type of Trade</strong></td><td><strong>Weight (KG)</strong></td><td><strong>Patacas</strong></td></tr><tr><td>Imports</td><td>5,126,243</td><td>220,168,854</td></tr><tr><td>Exports</td><td>1,240</td><td>175,619</td></tr></table>Source:The Statistics and Census Service, <a href="http://www.dsec.gov.mo/">http://www.dsec.gov.mo/</a>
SOURCE:
1. The Ministry of Foreign Affairs of the People’s Republic of China<a href="http://www.fmprc.gov.cn/chn/default.htm">http://www.fmprc.gov.cn/chn/default.htm</a>
2. The Ministry of Commerce of the People’s Republic of China<a href="http://zhs.mofcom.gov.cn/">http://zhs.mofcom.gov.cn/</a>
3.The Economic and Commercial Counselor ’s Office of the Embassy of the People’s Republic of China in the New Zealand<a href="http://co.mofcom.gov.cn/">http://au.mofcom.gov.cn/</a>
4. The Statistics and Census Service<a href="http://www.dsec.gov.mo/">http://www.dsec.gov.mo/</a>
5. The World Factbook<a href="http://www.cia.gov/">http://www.cia.gov/</a><div style="text-align: right;"><strong>MAJOR WEBSITE RECOMMENDATIONS:</strong>
<a href="https://www.govt.nz/">https://www.govt.nz/</a></div>%0D%0DPágina partilhada : %0Dhttps://www.ipim.gov.mo/pt-pt/publication/market-briefing-new-zealand/)