Pesquisar
 |
|
 |
|
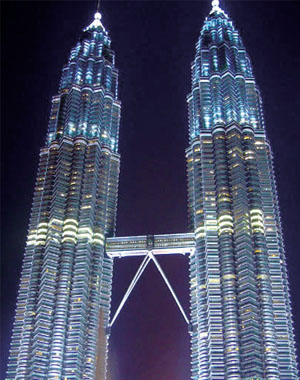
Petronas Twin Towers
|
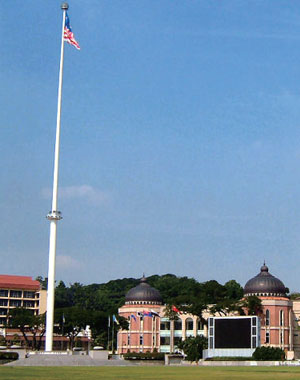
Merdeka Square in Kuala Lumpur
|
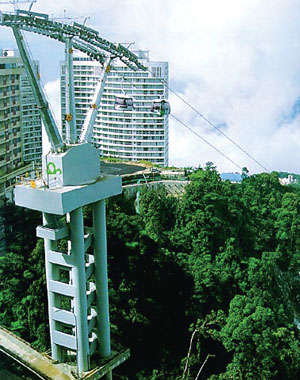
Genting Highlands
|
Overall Economic Situation
Malaysia is located in South-east Asia, bordered by Thailand in the north, Singapore in the south, China Sea in the east and Straits of Malacca in the west. It is rich in natural resources and rubber, palm oil and pepper is one of the world’s top producers and exporter. In early 70’s, the economy was dominated by agriculture and dependent on primary product exports. Since 1987, the economy has maintained a growth rate of above 8% for 10 consecutive years. In 1998, with the Asian financial turmoil, the economy registered negative growth, but by stabilising the exchange rate, restructuring bank corporate debt, expanding domestic demand and export policies, the economy began to steadily grow again. Since the second half of 2008, due to international financial crisis, domestic economic growth slowed down, the number of exports declined so in response the government launched economic stimulus measures. The economy has now gradually stabilised and begun to grow. In 2010 with “economic prosperity and social equity” as the theme of the Tenth Five-Year Plan a “new economic model” was introduced as the government continued to promote economic restructuring.
Business Opportunities
Industry and Mining
The Government encourages processing based industries of domestic raw materials, focusing on the development of electronic, automotive,steel, petrochemicals and textiles among others. The industrial production growth rate in 2010 was 7.4%. Mining consists mainly of tin,oil and gas exploration. According to Department of Statistics Malaysia,in 2009, the oil production was 2.4 million barrels and the liquefied natural gas production was 22.452 million tonnes.
Services
A wide range of services, include water, electricity, transportation, communications, wholesale,retail, hotels, restaurants, finance, insurance, real estate and services provided by government departments. Since the 1970s, the Malaysian government has constantly adjusted the industrial structure therefore the service industry has been developing rapidly, becoming one of the pillar industries of the economic development.
Agriculture, Husbandry, Forestry, Fisheries
Arable land makes up about 6.26 million hectares. Agriculture is based on cash crops, mainly palm oil, rubber and tropical fruit, among others. It has lush tropical forests. The fishing industry
has consisted mainly of inshore, saltwater flats, lakes and rivers although in recent years, deep-sea fishing and aquaculture industry have been developed.
Tourism
Tourism is the country’s third largest economy pillar and the second largest source of foreign exchange. Major tourist spots are: Kuala Lumpur, Genting, Penang, Malacca, Langkawi Island,Tioman Island, Redang Island and Pangkor Island. According to statistics from Tourism Malaysia,the number of tourists arriving in Malaysia in 2010 was 24 million bringing in revenue of 168 billion Ringgit (around US$53.48 billion).
|
Main Economic Indicators 2010
|
|
| Gross Domestic Product (US$ billion) |
414.4
|
| Real GDP growth (%) |
7.2%
|
| GDP per capita (%) |
14,700
|
| Inflation (%) |
1.7
|
| Land area (sq km) |
329,847
|
| Population (Million) |
28.7
|
Source: CIA- The World Face Book- Malaysia, https://www.cia.gov/library/publications/the-world-factbook/geos/my.html
ForeiGn Trade From 2006 TO 2010
|
Year
|
Total Trade
|
Exports
|
Imports
|
|
2010
|
$ 384,600
|
$ 210,300
|
$ 174,300
|
|
2009
|
$ 274,800
|
$ 157,500
|
$ 117,300
|
|
2008
|
$ 353,600
|
$ 198,900
|
$ 154,700
|
|
2007
|
$ 286,000
|
$ 158,700
|
$ 127,300
|
|
2006
|
$ 265,800
|
$ 147,100
|
$ 118,700
|
major export commodities: electronic equipment, petroleum and liquefied natural gas, wood and wood products, palm oil, rubber, textiles, chemicals
main import commodities: electronics, machinery, petroleum products, plastics, vehicles, iron and steel products, chemicals
Source: 1. CIA- The World Face Book- Malaysia, https://www.cia.gov/library/publications/the-world-factbook/geos/my.html
2. Index Mundi-Country Facts, http://www.indexmundi.com/malaysia/
| Main Destinations for Exports (2009) |
%
|
Main Origin of Imports (2009) |
%
|
| Singapore |
13.4
|
China |
12.6
|
| China |
12.6
|
Japan |
12.6
|
| Japan |
10.4
|
Singapore |
11.4
|
| US |
9.5
|
US |
10.7
|
| Thailand |
5.3
|
Thailand |
6.2
|
| Hong Kong |
5.1
|
Indonesia |
5.6
|
Source: https://www.cia.gov/library/publications/the-world-factbook/geos/my.html
Mainland China – Malaysia
|
Year
|
Total
|
Exports
|
Imports
|
|
2011 Jan-Nov
|
816.89
|
250.20
|
566.69
|
|
2010
|
742.15
|
238.06
|
504.10
|
|
2009
|
519.63
|
196.32
|
323.31
|
Source: Ministry of Commerce of the People’s Republic of China, http://yzs.mofcom.gov.cn/static/date/g/date.html/
Macao- Malaysia Bilateral Trade 2010
|
Type of Trade
|
Weight (KG)
|
Patacas
|
|
Imports
|
14,421,017
|
541,594,586
|
|
Exports
|
105,837
|
22,416,479
|
Source: The Statistics and Census Service, http://www.dsec.gov.mo/
SOURCE:
1. The Ministry of Foreign Affairs of the People’s Republic of China
http://www.fmprc.gov.cn/chn/default.htm
2. The Ministry of Commerce of the People’s Republic of China
http://www.mofcom.gov.cn/
3. The Economic and Commercial Counselor’s Office of the Embassy of the
People’s Republic of China in Malaysia
http://my.mofcom.gov.cn/index.shtml
4. The Statistics and Census Service
http://www.dsec.gov.mo/
5. The World Factbook
http://www.cia.gov/
Major Website Recommendations :
The Malaysia Government’s Official Portal
http://www.malaysia.gov.my/EN/Pages/default.aspx