Pesquisar
ECONOMIC SITUATION:
Indonesia is located in the Southeast part of Asia, straddling the equator. It borders Papua New Guinea, East Timor and Malaysia, with Singapore and Thailand to the north west , the Philippines to the north east and Australia to the south. The archipelago includes 17,508 islands between the Pacific Ocean and Indian Ocean, making it the world’s largest island state. It has a coastline of 54,716km, a territorial sea of 12nm and 200nm exclusive economic zone. Agriculture, industry and service sectors play an important role in the domestic economy. Among them, agriculture and petroleum are the country’s mainstay accounting for almost 60% of the national income.

Ubud Pasar Market
BUSINESS OPPORTUNITIES:
Food and Beverages
New areas of opportunity are expected to include: new lines of processed food and dairy products such as breakfast cereals, biscuits and flavoured milk; ingredients for the food services sector; technology transfer (e.g. in packaging and processing); consultancy services to the dairy industry. There are also opportunities for snacks (jams, health foods), non-alcoholic beverages, pre-packed food, transfer of technology and services and joint ventures or licencing arrangements for food products.
Construction and Infrastructure
Potential opportunities exist in airport infrastructure, road maintenance, toll-road construction, and operation, seaport development, and engineering services.
Dairy Products
Opportunities exist for products such as milk, butter (retail and wholesale) and cheese. Yoghurt and industrial dairy imports such as milk powder are also supplied to Indonesia. The local dairy industry requires expertise in dairy farming, processing, distribution and marketing, development and management of integrated facilities.
Transport and Storage
There are opportunities for recreational and industrial shipbuilding and sales; ship repairs; as well as freight and passenger transport services. Opportunities in the railway industry include passenger and freight transportation services and railway equipment manufacture. In line with the change in consumer demand for higher quality and more perishable products, it is expected that there will be an increase in the need for cold storage facilities.
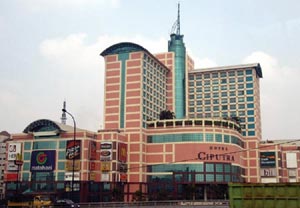
Hotel and Shopping Mall in Jakarta
MAJOR WEBSITE RECOMMENDATION:
DEPARTMENT OF TRADE
http://www.depdag.go.id
The website of Department of Trade in Indonesia will provide the latest information on commer cial policies, especially those relating to taxation, enterprises and foreign investment.
INDONESIAN GOVERNMENT WEBSITE
http://www.indonesia.go.id
The Indonesian Government Website is a formal website that publishes reliable information about the country’s policies, laws, government deci sions and social economic development.
STATISTICS FOR THE REPUBLIC OF INDONESIA
http://www.bps.go.id
As the primary statistical agency of the govern ment, The Statistics Bureau of The Republic of Indonesia produces and provides quality statistical and civil registration products and services.
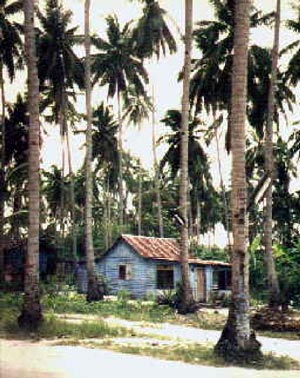
Batam Island
|
MAIN ECONOMIC INDICATORS 2006
|
|
| Gross Domestic Product (US$ Billions) | 935 |
| Real GDP growth (%) | 5.4% |
| GDP per capita (current US$) | 3,800 |
| Inflation (%) | 13.2% |
| Land area (ten thousand sq km) | 191.9 |
| Population (Million) | 245.4 |
FOREIGN TRADE FROM 2002 TO 2005
|
Year
|
Total Trade
|
Exports
|
Imports
|
|
2005
|
83,597
|
45,926
|
37,671
|
|
2004
|
113,721
|
68,677
|
45,044
|
|
2003
|
90,106
|
58,746
|
31,360
|
|
2002
|
85,059
|
55,021
|
30,038
|
Main Exports – commodities: Petroleum Products, Garments and Textiles, Natural Gas
Main Imports – commodities: Raw materials, Capital goods, Consumer goods
|
Main Destinations of Exports (2005)
|
%
|
Main Origins of Imports (2005)
|
%
|
|
Japan
|
24.3
|
Japan
|
21.6
|
|
USA
|
15.2
|
Mainland, China
|
12.6
|
|
Singapore
|
10.2
|
Singapore
|
11.7
|
|
Mainland, China
|
8.8
|
Thailand
|
7.6
|
MAINLAND CHINA – INDONESIA BILATERAL TRADE
|
Year
|
Total
|
Exports
|
Imports
|
|
2005
|
1,678,733
|
835,037
|
843,697
|
|
2004
|
1,347,209
|
625,642
|
721,567
|
|
2003
|
1,022,886
|
448,189
|
574,697
|
|
2002
|
793,480
|
342,645
|
450,835
|
MACAO – INDONESIA BILATERAL TRADE – MAIN ATEGORIES AND PRODUCTS IN 2005
|
Category
|
Weight (KG)
|
MOP
|
|
Imports
|
16,110,201
|
138,096,200
|
|
Exports
|
4,232
|
578,398
|
|
Re-exports
|
4,053
|
525,919
|
|
Transit
|
56,779
|
21,631,722
|
Note 1 : Exports = Domestic Exports + Re-exports
Note 2 : From May 2000, data on Transit is only available up to the 4th digit of NCEM/HS
SOURCE:
- The Ministry of Foreign Affairs of the People’s Republic of China
http://www.fmprc.gov.cn/chn/ - The Ministry of Commerce of the People’s Republic of China
http://www.mofcom.gov.cn/ - The Embassy of the People’s Republic of China in the Republic of Indonesia
http://id.china-embassy.org - The Economic and Commercial Counsellor’s office of the Embassy of the People’s Republic of China in the Republic of Indonesia
http://id.mofcom.gov.cn/index.shtml - Macao Statistics and Census Service
http://www.dsec.gov.mo/c_index.html - Macao Economic Services
http://www.economia.gov.mo - Macao Trade and Investment Promotion Institute
http://www.ipim.gov.mo/pt-pt/ - The Economist Intelligence Unit
- The Department of Trade of Indonesia
http://www.depdag.go.id - Indonesia Government Website
http://www.indonesia.go.id - Statistics of The Republic of Indonesia
http://www.bps.go.id - The Department of Industry and Resources of Australian Website
http://www.doir.wa.gov.au/exportandtrade - The World Factbook
http://www.cia.gov - Business-in-Asia
http://www.business-in-asia.com
