Pesquisar
 |
 |
 |
|
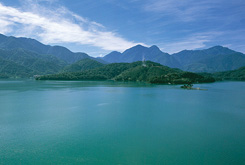
Sun Moon Lake
|
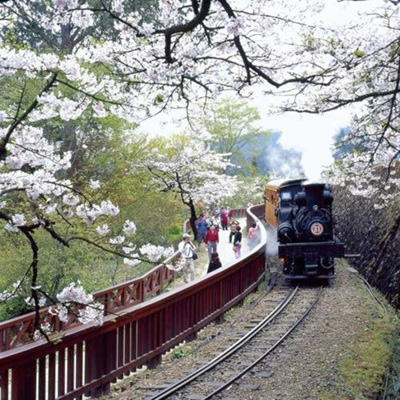
Ali Mountain Forest Railway
|
Taipei International Flora Exposition 2010
|
OVERALL SITUATION:
Taiwan is an island located in eastern Asia north of the Philippines, west of Japan, the Ryukyu Islands. It is a transportation hub for travellers to reach most Asian countries easily. It covers a total of around 36,000 square kilometres with a total population of 23 million. The expected economic growth rate in 2010 reached 9.9%, with foreign exchange reserves ranking fourth worldwide. In 2009, the GDP per capita for Taiwan amounted to US$16,353. Major industries include high technology and tropical agricultural products which are sources of foreign exchange income. Currently, industrial development focuses on Nanotechnology, solar energy and tourism.
BUSINESS OPPORTUNITIES:
High Technology Industry
Taiwan has been actively enhancing the development of traditional industries since 1990 and also implementing a high technology industry policy focusing on 10 emerging industries. These industries are communications, information, consumer electrical products, semi-conductors,precision machinery and automatic, aerospace, advanced materials, specialty chemical and pharmaceutical, medical health care and pollution prevention. Currently Taiwan is strong in the development of mechanical equipment, electronic manufacturing services, as well as other industries such as textile technology and agricultural and fisheries cultivation. In face of the challenge of globalisation, Taiwan has also strengthened the development of industries and technology including the knowledge based intensive service, bio-technology, deepening and broadening of IT, micro-electro-mechanical and nanotechnology industries.
Agriculture
In 2009, there were a total of 820,000 hectares of arable land in Taiwan, with 730,000 hectares of cultivated land. Main crops include rice, fruit trees, vegetables and cereals. The employed population in agriculture sector amounted to 542,000 in 2009, 5.3% of the total workforce. Agricultural production valued at NT3.9 billion, with agricultural products amounting to 45.38%, poultry products 33.76%, fisheries products 20.73% and forestry products 0.13% of the total agricultural production.
In Agricultural trade, agricultural product imports amounted to US$10 billion in 2009, with cereals and by-products, Chinese herbal medicine, timber and by-products as major imports, Agricultural exports amounted to US$3.2 billion, exported items included fish and by-products s well as leather and by-products.
Tourism
Taiwan possesses abundant natural and ecological resources, with atural eco systems, mountains, lakes, rivers, the ocean and hot springs.The multi-cultural backgrounds enrich Taiwan with resourceful and olourful tourism resources. Over the last two years, the development f tourism has been accelerated with liberalised policies to receive Mainland tourists, allowing the number of tourists to increase rapidly.In 2010, the total number of tourists amounted to 5.56 million, showing an increase of 26.67% year-on-year. Tourists from Mainland China totalled 1.63 million (a growth of 67.75%) and ranked first, followed by those from Japan, Hong Kong and Macao.
|
MAIN ECONOMIC INDICATORS 2009
|
|
|
Gross Domestic Product (US $ billion)
|
377.4
|
|
Real GDP growth (%)
|
-1.9
|
|
GDP per capita (US$)
|
16,353
|
|
Inflation (%)
|
-0.87
|
|
Land area (sq km)
|
36,191.5
|
|
Population (Million)
|
23.16
|
|
FOREIGN TRADE FROM 2006 TO 2010
|
|||
|
Year
|
Total Trade
|
Exports
|
Imports
|
|
2010
|
526,038
|
274,643
|
251,395
|
|
2009
|
378,046
|
203,675
|
174,371
|
|
2008
|
496,077
|
255,629
|
240,448
|
|
2007
|
465,929
|
246,677
|
219,252
|
|
2006
|
426,716
|
224,017
|
202,698
|
Major Export Commodities: Mechanical electrical equipment, basic metal products, precision instruments, plastics and rubber products, Chemicals
Main Import Commodities: Mechanical electrical equipment, mineral products, chemicals, basic metal products
|
Major Markets for Exports (2009)
|
%
|
Main Origin of Imports (2009)
|
%
|
|
Mainland China
|
9.64
|
USA
|
12.68
|
|
Germany
|
8.99
|
Mainland China
|
7.95
|
|
USA
|
8.48
|
Germany
|
7.36
|
|
France
|
4.35
|
||
|
Japan
|
4.35
|
|
MACAO – TAIWAN BILATERAL TRADE 2010
|
||
|
Type of Trade
|
Weight (KG)
|
Patacas
|
|
Imports
|
30,734,817
|
1,078,320,046
|
| Exports |
8,164,265
|
175,915,869
|
MACAO IN FIGURES
| 2007 | 2008 | 2009 | 2010 | |
| Population (thousands) | 538.1 | 549.2 | 542.2 | 549.5(1) |
| Nominal GDP (MOPmn) | 141,903(R) | 161,599(R) | 165,576(R) | 152,474(2) |
| GDP per capita (MOP) | 269,900(R) | 294,377(R) | 304,211(R) | – |
| GDP real growth (%) | 14.7(R) | 2.8(R) | 1.5(R) | 27.1(1) |
| Consumer Price Index (%) | 5.57 | 8.61 | 1.5(R) | 2.81 |
| Unemployment rate | 3.1 | 3.0 | 3.6 | 2.8 |
(1) 2010 Qtr 3
(2) Jan – Sep 2010
(R) Revised date
The Statistics and Census Service, http://www.dsec.gov.mo/
FLOORS FOR INDUSTRY, COMMERCE OR HOUSING – 4th QUARTER 2010
| For Sale | For Rental | |
| Industrial floors | 705 – 1,400 | 1.5 – 4 |
| Commercial Offices | 1,784 – 2,215 | 6 – 12 |
| Shops | 1,900 – 18,600 | 8.5 – 50 |
| Housing | 1,833 – 9,296 | 5 – 15.5 |
Note: The above data are for reference only
Source: Macao Association of Building Contractors and Developers