Search Issues
ECONOMIC SITUATION:
Russia stretches across the whole continent of Eurasia; it has an area of more than 17,000,000 square kilometres, which makes it the largest country in the world with a population of 140 million. Russia has rich and varied natural resources, with sufficient reserves, natural gas reserves have been proved to be 480 billion cubic metres, which accounts for 35% of the world’s known reserves and which makes it a world leader. Petroleum reserves are 6.5 billion tons, accounting for 13% of the world total. Gold ranks fourth or fifth in the world. Russia has a strong industrial foundation; main industries include electric power, petroleum, natural gas, machinery, iron and steel, metals coal, forestry and chemicals, lumber and lumber processing is also developing.

Russian City
BUSINESS OPPORTUNITIES:
Garments industry
There are currently 3,000 garment manufactures in Russia, with approximately 200 enterprises that meet international standards, most of them are sports clothes manufacturers, they are located mainly in Novosibirsk, Petersburg and Moscow. As Russia’s economic performance has improved in recent years, the income of residents has increased continuously; there is a growing demand for garments, which adds to the impetus in the development of Russia’s garment industry. After the financial crisis in 1998, the garment industry reached a turning point in its development. In 2005, the total value of Russia’s garment market reached US$30 billion; From January to March 2006, the output of Russia’s textile and garment industries was up 9.6% over the same period in 2005. The output of leather, leather goods and footwear also increased by 11.8%, among the main types of garments produced, suits increased by 32.5%, trousers by 17.7%, although the production of shirts and coats dropped by 2.3% and 14.9% respectively.
Tourism
Russia is rich in tourism attractions, the main ones being Moscow, St. Petersburg, the Baltic sea areas, the Volga River cruises, and the Primorsky Krai. Russia’s tourism industry developed rapidly in recent years, and is becoming a strong player in the economy. The number of visitor arrivals in 2005 was 22.19 million.
Logistic and Transportation Service
According to market research, the trade volume of logistic and transportation services in Russia is expected to grow by 90% from 2006 to 2012, the trade volume for transportation companies will increase by an average of 10% every year, the growth rate for cargo services will be higher than for transportation services, by an average of 12% every year, among which, storage and management services will also develop rapidly.

Moscow University
MAJOR WEBSITE RECOMMENDATION:
- THE MINISTRY OF ECONOMY WEBSITE
http://www.economy.gov.ru
The website of the Ministry of Economy in the Russian Federation provides the latest informa tion on commercial policies, especially those relating to taxation, enterprises and foreign investment. - THE RUSSIAN FEDERATION GOVERNMENT WEBSITE
http://www.gov.ru/index.html
The Russian Federation Government Website publishes reliable information on policies, laws, and government decisions and social economic development in Russia. - FEDERAL STATE STATISTICS SERVICE WEBSITE
http://www.gks.ru
As the primary statistical agency of the gov ernment, the Federal State Statistics Service produces and provides quality statistical and civil registration products and services.
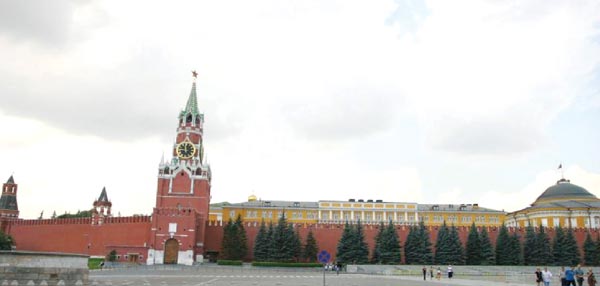
The Kremlin
|
MAIN ECONOMIC INDICATORS 2006
|
|
| Gross Domestic Product (US$ Billions) | 733 |
| Real GDP growth (%) | 6.6% |
| GDP per capita (current US$) | 12,100 |
| Inflation (%) | 9.8% |
| Land area (ten thousand sq km) | 1707.5 |
| Population (Million) | 141.4 |
Source: CIA- The World Fact Book-Russia
https://www.cia.gov/library/publications/the-world-factbook/geos/rs.html
| FOREIGN TRADE FROM 2002 TO 2006 (Unit: Million US$) | |||
|
Year
|
Total Trade
|
Exports
|
Imports
|
|
2006
|
489,100
|
317,600
|
171,500
|
|
2005
|
305,582
|
217,635
|
87,947
|
|
2004
|
232,209
|
163,812
|
68,397
|
|
2003
|
186,589
|
130,286
|
56,303
|
|
2002
|
150,093
|
104,896
|
45,197
|
Main Exports – commodities: Fuels, Metals, Machinery and Equipment, Chemicals
Main Imports – commodities: Machinery and Equipment, Food and Drink, Chemicals, Metals
|
Main Destinations of Exports (2005)
|
%
|
Main Origins of Imports (2005)
|
%
|
|
Germany
|
7.9
|
Germany
|
13.0
|
|
China
|
6.1
|
Mainland, China
|
5.8
|
|
Netherlands
|
6.1
|
Ukraine
|
5.8
|
|
United States
|
5.7
|
Italy
|
5.1
|
|
MAINLAND CHINA – RUSSIA BILATERAL TRADE (Unit: US$ 10 thousand)
|
|||
|
Year
|
Total
|
Exports
|
Imports
|
|
2006
|
3,338,655
|
1,583,243
|
1,755,412
|
|
2005
|
2,910,314
|
1,321,225
|
1,589,090
|
|
2004
|
2,123,196
|
910,250
|
1,212,946
|
|
2003
|
1,576,062
|
603,455
|
972,607
|
|
2002
|
1,192,746
|
352,063
|
840,683
|
|
MACAO – RUSSIA BILATERAL TRADE – MAIN CATEGORIES AND PRODUCTS IN 2006
|
||
|
Category
|
Weight (KG)
|
MOP
|
|
Imports
|
2,008,470
|
6,583,046
|
|
Exports
|
11,764
|
1,702,386
|
|
Re-exports
|
11,764
|
1,702,386
|
|
Transit
|
3,493
|
509,956
|
Note 1 : Exports = Domestic Exports + Re-exports
Note 2 : From May 2000, data on Transit is only available up to the 4th digit of NCEM/HS
SOURCE:
- The Ministry of Foreign Affairs of the People’s Republic of China
http://www.fmprc.gov.cn/chn/ - The Ministry of Commerce of the People’s Republic of China
http://www.mofcom.gov.cn/ - The Embassy of the People’s Republic of China in the Russian Federation
http://ru.china-embassy.org/chn/ - The Economic and Commercial Counsellor’s office of the Embassy of the People’s Republic of China in the Russian Federation
http://id.mofcom.gov.cn/index.shtml - Macao Statistics and Census Service
http://www.dsec.gov.mo/c_index.html - Macao Economic Services
http://www.economia.gov.mo/ - The Economist Intelligence Unit
http://www.ipim.gov.mo/en/ - The Ministry of Economy of the Russian Federation
http://www.economy.gov.ru - The Russian Federation Government
http://www.gov.ru/index.html - Federal State Statistics Service
http://www.gks.ru - The World Fact book
http://www.cia.gov