Search Issues
 |
 |
 |
|
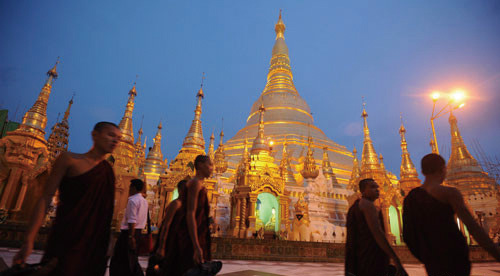
The national capital Yangon (Rangoon)
is the largest city of Myanmar |
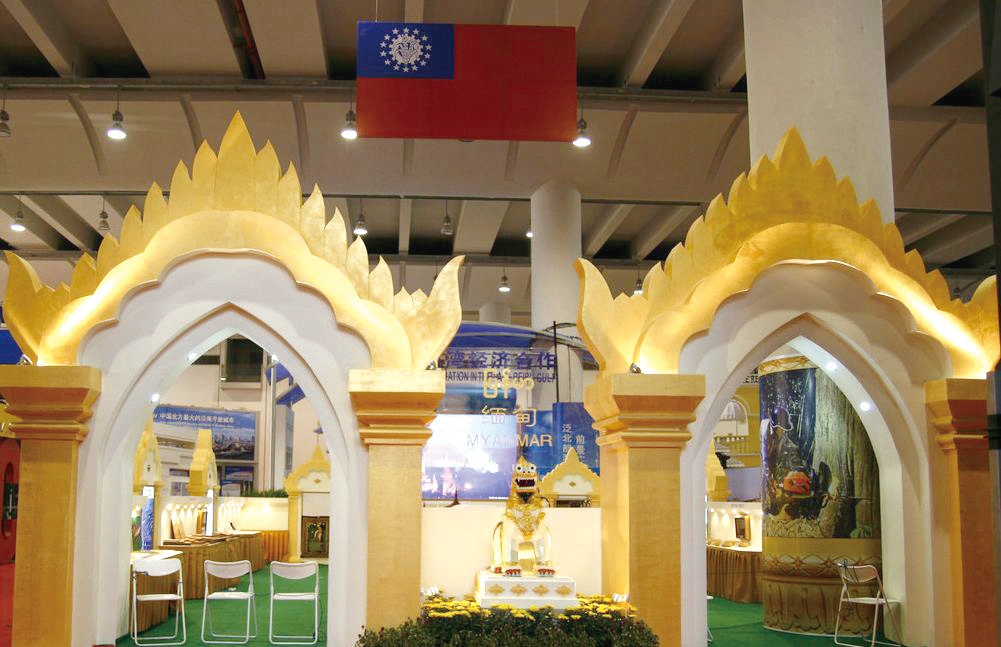
As an exhibition Country of Honor of the
9th China – ASEAN Expo in 2012, Myanmar showed its new phase of eco-development and business opportunities |
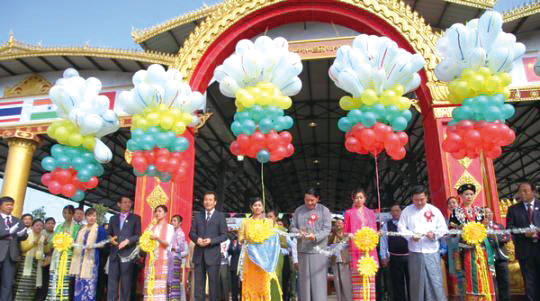
The 12th Myanmar – China Border Trade Fair opened in Myanmar’s Muse 105th Mile Border
Trade Zone in Northern Shan State on Dec. 10, 2012 |
OVERALL ECONOMIC SITUATION
The Republic of the Union of Myanmar is located on the west of Indochina. It bordered by China in the north-east, India and Bangladesh in the north-west, Laos and Thailand in the south-east, and the Bay of Bengal and the Andaman Sea in the south. It has an advantageous natural environment and rich in natural resources including tin, tungsten, zinc, aluminium, antimony, manganese, gold and silver. The precious stones and jade mined in the country have an excellent reputation around the world. There are greater reserves of petroleum and natural gas on the mainland and the coastal areas.
In early 2011, Myanmar government issued the Myanmar Special Economic Zone Law to actively attract foreign investment, and improvements were shown to have been made in the trade and investment environment in the country. On 1 April 2012, a floating exchange rate system was adopted and western countries have gradually lifted their economic sanctions on the country.
BUSINESS OPPORTUNITIES
Industries
Industrial volume amounted to 20% of the GDP. There are 18 industrial areas, 9,849 factories in Myanmar with a workforce of around 1.74 million. Major industries including petroleum and natural gas extraction, small machinery manufacturing, textiles, dyeing, rice grinding, timber processing, sugar manufacturing, paper making, chemical fertilisers and pharmaceutical.
Agricultural, timber, animal husbandry and fisheries industries
Agriculture the economic foundation of the country amounted to 40.2% of the GDP. The agricultural work force totalled 18.9 million, amounting to 70% of total labour force. There are 84.7 hectares of arable land with major crops including rice, wheat, corn, peanuts, sesame, cotton, beans, sugar cane, oil palms tobacco and turmeric.
Animal husbandry and fisheries industries are operated by private companies. There are currently 144 export companies for aquaculture products, selling to 49 countries and regions, in the fiscal year of 2011/2012, the export value amounted to over US$650million.
Forest coverage amounted to 52% with 132,715 of forest area. Major products including hard wood such as teak, scented rosewood, wenge, ebony, guajacwood, as well as rattan and bamboo.
Tourism
The country possesses beautiful landscapes and famous tourist attractions, including the Shwedegon Pagoda, heritage city of Mandalay, Bagan and Tambuli beaches. The government actively encourages and supports the development of tourism and attracts foreign investment for the construction of tourism facilities. As of May 22012, there are 744 hotels of various sizes and tourists from around the world amounted to 816,000.
|
MAIN ECONOMIC INDICATORS 2011
|
|
| Gross Domestic Product(US$ billion) | 82.68 |
| Real GDP growth (%) | 5.5 |
| GDP per capital(US$) | 1,300 |
| Inflation(%) | 5 |
| Land area(sq km) | 676,578 |
| Population (Million) | 54.6 |
Source: CIA-The World Factbook, https://www.cia.gov/library/publications/the-world-factbook/geos/bm.html
FOREIGN TRADE FROM 2007 TO 2011
|
Year
|
Total Trade
|
Exports
|
Imports
|
| 2011 | $14.19 | $8.21 | $5.98 |
| 2010 | $12.37 | $7.84 | $4.53 |
| 2009 | $10.88 | $6.86 | $4.02 |
| 2008 | $9.78 | $6.35 | $3.43 |
| 2007 | $5.54 | $3.56 | $1.98 |
Major Export Commodities: natural gas, wood products, pulses, beans, fish, rice, clothing, jade and gems
Main import Commodities: fabric, petroleum products, fertilizer, plastics, machinery, transport equipment; cement, construction materials, crude oil; food products, edible oil
Source:
1. CIA-The World Factbook, https://www.cia.gov/library/publications/the-world-factbook/geos/bm.html
2. Index Mundi-Country Fact, http://www.indexmundi.com/burma/
| Main Destinations for Exports (2011) | % |
| Thailand | 36.7 |
| China | 18.8 |
| India | 14.1 |
| Japan | 6.6 |
| Main Origin for Imports (2011) | % |
| China | 38.8 |
| Thailand | 22.6 |
| Singapore | 9.7 |
| South Korea | 5.4 |
| Malaysia | 4.5 |
Source:https://www.cia.gov/library/publications/the-world-factbook/geos/bm.html
MAINLAND CHINA –MYANMAR
| Year | Total | Exports | Imports |
| 2012(1-11月) | 61.68 | 50.32 | 11.37 |
| 2011 | 65 | 48.22 | 16.78 |
| 2010 | 44.44 | 34.8 | 9.64 |
| 2009 | 29.07 | 22.61 | 6.46 |
Source: Ministry of Commerce of the People’s Republic of China, http://yzs.mofcom.gov.cn/static/date/g/date.html/
MACAO- MYANMAR BILATERAL TRADE 2011
| Type of Trade | Weight (KG) | Patacas |
| Imports | 457,236 | 21,682,621 |
| Exports | 180 | 51,271 |
Source: The Statistics and Census Service,http://www.dsec.gov.mo/
SOURCE:
1. The Ministry of Foreign Affairs of the People’s Republic of China
http://www.fmprc.gov.cn/chn/default.htm
2. The Ministry of Commerce of the People’s Republic of China
3. The Economic and Commercial Counselor’s Office of the Embassy of the People’s Republic of China in the Republic of the Union of Myanmar
http://br.mofcom.gov.cn/index.shtml
4. The Statistics and Census Service
http://br.mofcom.gov.cn/index.shtml
5. The World Factbook
MAJOR WEBSITE RECOMMENdATIONS: