Brazil
|
National flag |
|
|
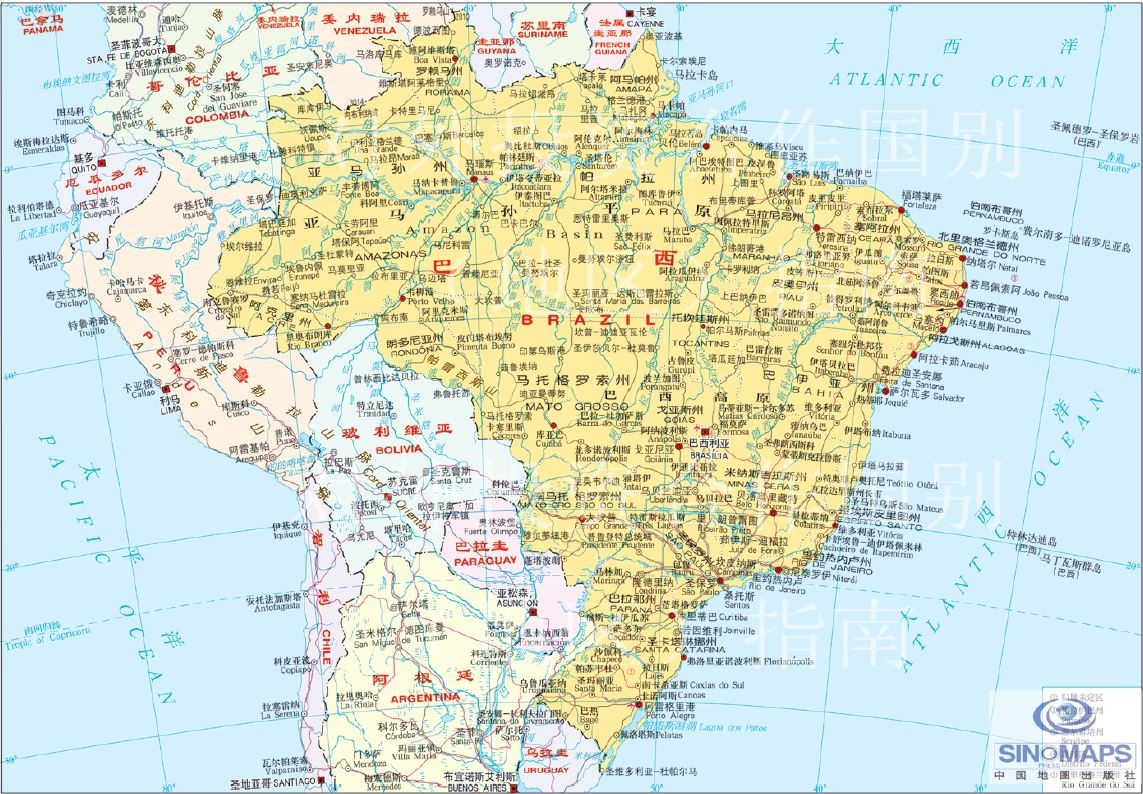
Map |
|
|
Basic Information |
Located in southeastern part of South America, Brazil is the country with the largest area and the largest population in Latin America; it has a land area of more than 8.547 million square kilometres and a population of around 200 million in 2023 (IMF estimate). The capital is Brasilia, which is the political centre of Brazil. Sao Paulo is the largest city and the national centre for industry, commerce, finance and transportation |
|
Investment Situation |
Brazil ranks the 9th largest economy in the world and has a sound legal system. It has also huge market capacity, large amount of resources and great influence in the global market. In recent years, the government has encouraged foreign investment to Brazil’s traditional advantageous industries and innovative industries, namely agriculture, automobiles, renewable energy, life sciences, oil and gas, and digital technology; according to investment scale and other indicators of different projects, it has granted targeted policy support and fee reductions. The service industry is the most productive sector in Brazil, accounting for more than 70% of GDP. Brazil’s tourism industry is also competitive in the world. In addition, Brazil is a major exporter of agricultural products, mainly exporting soybeans, corn, cane sugar, coffee and tobacco. Its industrial strength also ranks first in Latin America. Other sectors of the country including nuclear power, communications, electronics, aircraft manufacturing are playing advanced role in the world. According to the “2023 World Investment Report” published by the United Nations Conference on Trade and Development (UNCTAD), at the end of 2022, Brazil has attracted US$815.63 billion on stock of inward direct investment. According to the “2022 Statistical Bulletin of China’s Outward Foreign Direct Investment”, by the end of 2022, the stock of direct investment of China in Brazil was US$3.41 billion, mainly in the fields of agriculture, energy, power, manufacturing and technology innovation. |
|
Trade on Goods |
In 2022, Brazil’s main export destinations include China, the United States, Argentina and the Netherlands. The main exports are soybeans, oil, iron ore and meat. Its main sources of import include China, the United States, Argentina and Germany, others and the main imported goods include machinery, minerals and organic chemicals. Since 2009, China has been the largest trading partner of Brazil for ten consecutive years. At the same time, Brazil is China’s largest trading partner in Latin America and the BRICS countries. In 2023, China’s exports to Brazil amounted to US$59.11 billion, main exports to Brazil include solar battery, low value simple customs clearance goods, Floating, submersible drilling or production platform; imports from Brazil amounted to US$122.42 billion, mainly include soybeans, iron ore and concentrates, crude oil. |
Main Economic Indicators of recent three years
|
2021 |
2022 |
2023 |
|
|
Population (million) |
202.02 |
203.06 |
204.25 |
|
GDP (US$ billion) |
1,670 |
1,950 |
2,170 |
|
Real GDP Growth Rate (%) |
4.8 |
3.0 |
2.9 |
|
Total Export of Goods (US$ million) |
280,815 |
334,136 |
339,696 |
|
Total Import of Goods (US$ million) |
234,690 |
292,245 |
252,710 |
|
Total Export of Services (US$ million) |
31,482* |
39,455* |
45,194 |
|
Total Import of Services (US$ million) |
58,439* |
79,473* |
82,790 |
|
Inflation measured by the Consumer Price Index (Annual Inflation rate%) |
8.3 |
9,3 |
4.6 |
|
Current Account Balance (US$ billion) |
-46.358 |
-48.253 |
-28.616 |
Source: “*”Data of World Trade Organization (WTO) and the others of International Monetary Fund (IMF)
Statistics on the Trade of Goods between Mainland China and Brazil of recent three years (US$ thousands)
|
Year |
Total Trade |
Total Exports value |
Total Imports value |
|
2023 |
181,529,226 |
59,107,760 |
122,421,466 |
|
2022 |
171,492,014 |
61,969,971 |
109,522,043 |
|
2021 |
164,063,194 |
53,614,093 |
110,449,101 |
Remarks: “Exports” refers of goods exported to Brazil from Mainland China; “Imports” refers of goods imported from Brazil to Mainland China Source of Data: General Administration of Customs of the People’s Republic of China
Statistics on the Trade of Goods between Macao SAR and Brazil of recent three years (US$) (US$ 1≈ MOP 8)
|
Year |
Total Trade |
Total Exports value |
Total Imports value |
|
2023 |
138,437,576.4 |
47,649.1 |
138,389,927.3 |
|
2022 |
97,156,236.3 |
88,478.8 |
97,067,757.5 |
|
2021 |
55,855,306.6 |
167,839.1 |
55,687,467.5 |
Remarks: “Exports” refers of goods exported to Brazil from Macao; “Imports” refers of goods imported from Brazil to Macao. Source of Data: Statistics and Census Service (DSEC), Macao SAR Government
Sources:
- “Country (region) guide for foreign investment cooperation (Brazil)” by the Ministry of Commerce of the People’s Republic of China
- “2022 Statistical Bulletin of China’s Outward Foreign Direct Investment” by the Ministry of Commerce of the People’s Republic of China, National Bureau of Statistics and State Administration of Foreign Exchange
- General Administration of Customs of the People’s Republic of China
- SinoMaps Press
- Statistics and Census Service (DSEC), Macao SAR Government
- International Monetary Fund (IMF)
- World Trade Organization (WTO)
- International Trade Center (ITC)
- “2023 World Investment Report” by the United Nations Conference on Trade and Development (UNCTAD)
Updated in April 2024.