Pesquisar
 |
 |
 |
|
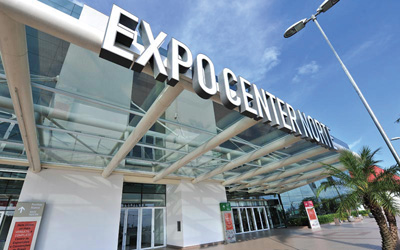
São Paul Expo Center Norte
|
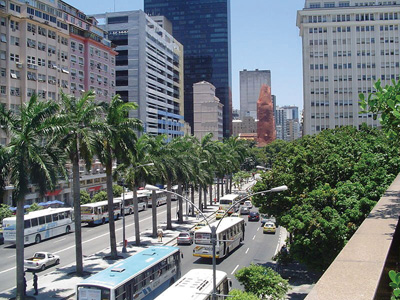
Rio de Janeiro is the second largest city
in Brazil |
ABF Franchising Expo 2012
|
ECONOMIC SITUATION
Brazil is located in the south-east of South America, bordered on the north by French Guiana, uriname, Venezuela and Columbia; on the west by Peru and Bolivia; on the south by Paraguay, Argentina and Uruguay, and the Atlantic Ocean on the east. In 2011, the GDP ranked sixth in the world and was the strongest economy of all Latin American countries. Agriculture and animal husbandry are well-developed and is the biggest manufacturer and exporter of sugarcane, coffee, citrus, corn, chicken, beef, tobacco and soya bean. Brazil has an extensive and diverse industrial base, with relatively prosperous growth in petrochemical, mining, steel and automobile manufacturing. It is a world leader in the development in civil transport aircraft manufacturing and biofuel industries. The service industry accounts for nearly 60% of the national GDP with rapid growth in the financial industry, resulting in an economic structure comparable to the standard of developed countries.
BUSINESS OPPORTUNITIES
Industries
A relatively total industrial structure was established in 1970s so a 10.1% industrial growth was recorded in 2010. Major industries include steel, automobile production, petroleum, cement, etallurgy, electricity, construction, textiles, shoe-making, paper-making and food production. Since the mid-1990s, production in pharmaceuticals, food, plastic, electrical appliances, communications equipment and transportation vehicles have also achieved rapid growth.
Agriculture and Animal Husbandry
There are a total of 152.5 million hectares of arable land; cultivated land amounted to 46.6 million hectares and 177 million hectares of grazing. Brazil is the largest producer and exporter of sugar, the second largest producer and exporter of soya beans and ranks third in corn production and among the top five exporters of corn. It is also the largest exporter of beef and chicken. In 2010, there was a 6.5% growth in agriculture and animal husbandry, with a total of 149.5 million tonnes of food produced.
Service Industry
A 5.4% growth was recorded in 2010. Major industries include fixed assets, rent and leasing, tourism, financial, insurance, telecommunications, advertising and technical services.
Tourism
According to the figures provided by the Brazilian tourism department, in 2011, Brazil welcomed a total of 5.4 million visitors with foreign exchange income of US$6.775 billion. There are more than 9,000 travel agencies in the country with 1.87 million workers involved in the tourism industry. Major tourism cities and attractions include Rio de Janeiro, Sao Paulo, El Salvador, Brasilia, Iguazu Falls, Port of Manaus, Ouro Preto and Pantanal.
Source:
http://www.expocenternorte.com.br/index.asp
www.structural-communication.com
http://exame.abril.com.br/pme/noticias/maior-feira-de-franquias-do-mundo-comeca-hoje
|
MAIN ECONOMIC INDICATORS 2011
|
|
| Gross Domestic Product(US$ trillion) | 2.324 |
| Real GDP growth (%) | 2.7 |
| GDP per capital(US$) | 11,900 |
| Inflation(%) | 6.5 |
| Land area(sq km) | 8,514,877 |
| Population (Million) | 205.7 |
Source: CIA-The World Factbook –Angola, https://www.cia.gov/library/publications/the-world-factbook/geos/ao.html
FOREIGN TRADE FROM 2007 TO 2011
|
Year
|
Total Trade
|
Exports
|
Imports
|
| 2011 | $ 475.6 | $ 256 | $ 219.6 |
| 2010 | $ 387.4 | $ 199.7 | $ 187.7 |
| 2009 | $ 280.7 | $ 153 | $ 127.7 |
| 2008 | $ 371 | $ 197.9 | $ 173.1 |
| 2007 | $ 228.9 | $ 137.5 | $ 91.4 |
Major Export Commodities: transport equipment, iron ore, soybeans, footwear, coffee, autos
Main Import Commodities: machinery, electrical and transport equipment, chemical products, oil, automotive parts, electronics
Source:
1. CIA-The World Factbook –Brzial, https://www.cia.gov/library/publications/the-world-factbook/geos/br.html
2. Index Mundi-Country Fact, http://www.indexmundi.com/brazil
| Main Destinations for Exports(2011) | % |
| China | 17.3 |
| US | 10.1 |
| India | 8.9 |
| Canada | 5.3 |
| Main Origin of Imports(2011) | % |
| US | 15.1 |
| China | 14.5 |
| Portugal | 7.5 |
| Brazil | 6.7 |
| South Africa | 4.5 |
Source: https://www.cia.gov/library/publications/the-world-factbook/geos/br.html
MAINLAND CHINA – BRAZIL
| Year | Total | Exports | Imports |
| 2012 Jan-Sep | 654.22 | 248.35 | 405.87 |
| 2011 | 842.01 | 318.42 | 523.59 |
| 2010 | 625.5 | 244.7 | 380.8 |
| 2009 | 423.9 | 141.1 | 282.8 |
Source: General Administration of Customs of the People’s Republic of China. http://www.customs.gov.cn/
MACAO – BRAZIL BILATERALTERAL TRADE 2011
| Type of Trade | Weight (KG) | Patacas |
| Imports | 13,078,498 | 228,396,408 |
| Exports | 7,586 | 1,169,234 |
Source: The Statistics and Census Service, http://www.dsec.gov.mo/
MAJOR WEBSITE RECOMMENDATIONS:
THE BRAZIL GOVERNMENT’S OFFICIAL PORTAL:
http://www.brasil.gov.br/
SOURCE:
1. The Ministry of Foreign Affairs of the People’s Republic of China
http://www.fmprc.gov.cn/chn/default.htm
2. The Ministry of Commerce of the People’s Republic of China
http://www.mofcom.gov.cn
3. General Administration of Customs of the People’s Republic of China
http://www.customs.gov.cn/
4. The Economic and Commercial Counselor’s Office of the Embassy of the People’s Republic of China in Indonesia
http://br.mofcom.gov.cn/index.shtml
6. The Statistics and Census Service
http://www.dsec.gov.mo/
7. The World Factbook
http://www.cia.gov/