Pesquisar
 |
 |
 |
|
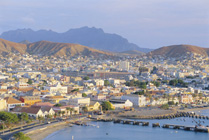
Town of Mindelo
|
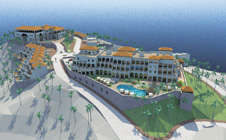
Fortim Mindelo – “The Best New Development in the 2008 CNBC Europe & Africa Property” on the Cape Verde Islands
|
The People ‘s Congress Hall aided by China
|
Economic Situation: The Cape Verde Islands are located in the mid-Atlantic Ocean some 500 km off the west coast of Africa. The archipelago includes 10 islands and 5 islets, divided into windward and leeward groups, with Praia as its capital. Since 1991, the government has pursued market-oriented economic policies, including an open door to foreign investors and a farreaching privatistion programme. The promotion of the market economy and private sector; tourism, light manufacturing industries and fisheries are launched as the Government priority for development.
Business Opportunities
Industry, Agriculture and Fishing
Although nearly 70% of the population lives in rural areas, agriculture and fishing accounted for 9.1% of Cape Verde’s GDP in 2008, with 25% of the population are engaged in the agriculture and fishing industries. About 82% of food must be imported. The fishing industry is growing and contributes to a large portion of the country’s exports. The main products are Bananas, Corn, Beans, Sweet Potatoes, Sugarcane, Coffee, Fish. In addition, the types of industries are food and beverages, fish processing, shoes and garments, salt mining, ship repair.
Tourism
Tourism has been a major source of employment and economic growth. In 2006, the total income of tourism is 220 millions US dollar, contributing about 18.3% of GDP. Several new hotels have been opened in the past few years, bringing the total number of hotels to 132 and
the number of rooms to 4,406 in 2006. Tourists arrival amounted to 300,000 in 2007, with those mainly come from European countries, such as Italy (34.9%), Portugal (25.2%) and Germany (11.2%). In 2008, the government’s goal is to attract 400,000 tourists per year.
Foreign Trade
The country’s merchandise export are extremely low in relation to imports, although sales of textile and electronic components are expanding. Small amounts of bananas, canned tuna, frozen fish, lobster, salt and pozzolana are also exported. The country imports most of its required food, as well as fuel, manufactured products and other goods. Trade links with Portugal have strengthened since 1990, accounted for over half of all imports and exports in 2003. EU countries accounted for around 90% of all exports and imports.
Source:
1. The Ministry of Foreign Affairs of the People’s Republic of China, http://www.fmprc.gov.cn/chn/default.htm
|
MAIN ECONOMIC INDICATOR S 2008
|
|||
|
Gross Domestic Product (US$ Billions)
|
1.635
|
||
|
Real GDP growth (%)
|
6
|
||
|
GDP per capita (US$)
|
3,800
|
||
|
Inflation (%)
|
5
|
||
|
Land area (sq km)
|
4,033
|
||
|
Population (Million)
|
429,474
|
||
Source:
1. CIA- The World Fact Book-Cape Verde, https://www.cia.gov/library/publications/the-world-factbook/geos/cv.html
2. Index Mundi-Country Fact, http://indexmundi.com/
Major Website Recommendations :
- National Statistical Institute (INE),http://www.ine.cv/
As the official statistic agency, the National Statistical Institute (INE) is in charge of the
production and provision of quality statistical products.
|
Foreign Trade from 2007 to 2008 (Unit: Million US$)
|
|||
|
Year
|
Total Trade
|
Exports
|
Imports
|
|
2008
|
965
|
99
|
866
|
|
2007
|
820.1
|
76.5
|
743.6
|
Source:
1. CIA- The World Fact Book-Cape Verde,
https://www.cia.gov/library/publications/the-world-factbook/geos/cv.html
2. Index Mundi-Country Fact, http://indexmundi.com/
Main Export Commodities: fuel, shoes, garments, fish, hides
Main Import Commodities: food, fuel, industrial products, transport equipment
|
Main Destinations of Exports (2007)
|
%
|
Main Origins of Imports (2007)
|
%
|
|
Japan
|
37.8
|
Portugal
|
39.5
|
|
Spain
|
28.7
|
Netherlands
|
11.4
|
|
Portugal
|
17.7
|
Spain
|
6.5
|
|
UK
|
6.3
|
||
|
Cote d’ Ivoire
|
4.4
|
||
|
Brazil
|
4
|
Source: CIA-The World Fact Book- Cape Verde
https://www.cia.gov/library/publications/the-world-factbook/geos/cv.html
|
Mainland China – Cape Verde Trade (Unit: US $10,000)
|
|||
|
Year
|
Total
|
Exports
|
Imports
|
|
2008
|
1,300
|
1,300
|
0
|
|
2007
|
1,470
|
1,470
|
0
|
|
2006
|
1,009
|
1,009
|
0
|
|
2005
|
519
|
519
|
0
|
|
2004
|
275
|
275
|
0
|
|
2003
|
260
|
260
|
0
|
Source:
The Ministry of Foreign Affairs of the People’s Republic of China,
http://www.mofcom.gov.cn/?2258435937=1387823906
|
Macao- Brazil Bilateral Trade 2008 (Unit: thousand MOP)
|
||
|
Trade type
|
Weight (KG)
|
Macao Patacas
|
|
Imports
|
12
|
14,949
|
Source: The Statistics and Census Service ,http://www.dsec.gov.mo/
Source:
- The Ministry of Foreign Affairs of the People’s Republic of China
http://www.fmprc.gov.cn/chn/default.htm - The Ministry of Commerce of the People’s Republic of China
http://www.mofcom.gov.cn/ - Macao Statistics and Census Service
http://www.dsec.gov.mo/c_index.html - The World Factbook
http://www.cia.gov/ - World Economic Forum
http://www.wcforum.org/