Pesquisar
 |
 |
 |
|
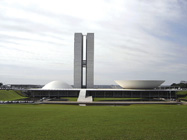
The National Congress in Brasília,the capital of Brazil
|
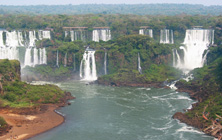
One of the tourism destinations in Brazil- Iguazu Fall
|
Metropolitan Cathedral, Brasília
|
Economic Situation: Brazil is the largest of the Latin American countries. The French Guiana and the countries of Suriname, Guyana, Venezuela, and Colombia bound Brazil on the north. Uruguay, Argentina and Paraguay are on the south, and on the west are Bolivia and Peru. The Atlantic Ocean extends along the entire eastern side of the country, with Brasilia as its capital. Brazil trades with over one hundred nations, with 74% of exports represented by manufactured or semi manufactured goods. Its main partners are: the European Union (representing 26% of the balance), the US (24%), Mercosul and Latin America (21%) and Asia (12%). One of the most dynamic sectors in this trade scenery is the so-called “agro business” sector, which for two decades has kept Brazil amongst the most highly productive countries in areas related to rural sector.
Business Opportunities::
Industries
Brazil’s manufacturing industry is the largest and most diverse in Latin America. In addition to traditional sectors, such as machine tools, electrical equipment and cars, several technologically advanced industries have developed during the past decade, two of the most significant of which are aircraft manufacturing and the production of telecommunications equipment. The main products are textiles, shoes, chemicals, cement, lumber, iron ore, tin, steel, aircraft, motor vehicles and parts, other machinery and equipment.
Agriculture
Agriculture accounts for 34% of Brazil’s GDP, 37% of all jobs nationwide and represents 43% of national exports, making it the only sector, among all the export sectors in the country, to produce a surplus. The Ministry for Agriculture, Livestock and Supply predicts that a further 30 million hectares will be added to the country’s current 62 million hectares of planted land within the next 15 years, to be yielded by grazing lands, thanks to the technological development achieved in the cattle-raising areas of meat production and dairy farming. Main products are coffee, soybeans, wheat, rice, corn, sugarcane, cocoa, citrus and beef, etc.
Tourism
The World Travel and Tourism Council, a travel industry forum, estimates that Brazil’s travel and tourism industry accounted for 3% of GDP and provided employment for 2.5% of the workforce. In 2007, the number of tourists increased to 9 million. The main tourist categories are beach tourism, eco-tourism and city tourism associated with carnivals, and majority of visitors are proceeding from Europe, America (North and South) and Asia and tourism destinations are Rio de Janeiro, St. Paul, Brasilia, Iguazu Fall, etc.
According to Travel & Tourism Competitiveness Report 2009, which is a measurement of the factors that make it attractive to develop business in the travel and tourism industry of individual countries, Brasil is ranked 45th overall and 2nd in Latin America. Brazil main competitive advantages are shown by the subindex measuring human, cultural, and natural resources. The country is ranked 2nd out of all countries for its natural resources and 14th for its cultural resources, with many World Heritage sites, a great proportion of protected land area, and the most diverse fauna in the world.
Source:
1. The Ministry of Foreign Affairs of the People’s Republic of China, http://www.fmprc.gov.cn/chn/default.html
2. http://www.brazil-real-estate.co.uk/Brazil-Property-Buyers-Guide.html
|
MAIN ECONOMIC INDICATOR S 2008
|
|||
|
Gross Domestic Product (US$ Billions)
|
1.570,0
|
||
|
Real GDP growth (%)
|
5.1
|
||
|
GDP per capita (US$)
|
8,298
|
||
|
Inflation (%)
|
5.9
|
||
|
Land area (sq km)
|
8,511,965
|
||
|
Population (Million)
|
191,9
|
||
Source: Index Mundi-Country Facts,http://indexmundi.com
Major Website Recommendations :
- The official website of the Federative Republic of Brazil,
http://www.brasil.gov.br/
Official site provides news and information about government structure, events, programs and projects, tourism, economy and business. - Brazilian Institute of Geography and Statistic,
http://www.ibge.gov.br/english/default.php
Official statistic organization, the Institute of Geography and Statistic is in charge of the compilation and production of correct and up-to-date statistical products. - China-Brazil Business Council,
http://www.cebc.com.br
The China-Brazil Business Council is a non-profit organization dedicated to promoting dialogue among Brazilian and Chinese companies. The CBBC focuses its efforts on addressing structural issues underlying bilateral relations, with the objective of enhancing the Brazil-China trade and investment environment.
|
Foreign Trade from 2004 to 2008 (Unit: US$ billions)
|
|||
|
Year
|
Total Trade
|
Exports
|
Imports
|
|
2008
|
371.1
|
197.9
|
173.2
|
|
2007
|
281.3
|
160.6
|
120.6
|
|
2006
|
229.2
|
137.8
|
91.4
|
|
2005
|
191.8
|
118.3
|
73.5
|
|
2004
|
160.3
|
96.5
|
63.8
|
Source: www.portalbrasil.net
Main Export Commodities: transport equipment, iron ore, soybeans, footwear, coffee, autos
Main Import Commodities: machinery, electrical and transport equipment, chemical products, oil, automotive parts, electronics
|
Main Destinations of Exports (2007)
|
%
|
Main Origins of Imports (2007)
|
%
|
|
US
|
14.0
|
US
|
14.9
|
|
Argentina
|
8.9
|
China
|
11.6
|
|
China
|
8.3
|
Argentina
|
7.7
|
|
Netherlands
|
5.3
|
Germany
|
6.9
|
|
Germany
|
4.5
|
Japan
|
3.9
|
Source: Ministry of Development, Industry and Foreign Trade (Brazil)
|
Mainland China – Brazil Trade (Unit: US $10,000)
|
|||
|
Year
|
Total
|
Exports
|
Imports
|
|
2008(1-10)
|
4,254,434
|
1,663,853
|
2,590,582
|
|
2007
|
2,970,504
|
1,137,203
|
1,833,301
|
|
2006
|
2,029,997
|
737,995
|
1,292,002
|
|
2005
|
1,481,729
|
482,755
|
998,974
|
|
2004
|
1,235,898
|
367,485
|
868,413
|
|
2003
|
798,856
|
214,476
|
584,380
|
Source: Ministry of Commerce of the People’s Republic of China,http://zhs.mofcom.gov.cn/
|
Macao- Brazil Bilateral Trade 2008 (Unit: thousand MOP)
|
|||
|
Year
|
Total
|
Exports
|
Imports
|
|
2008
|
160,609.49
|
10,644.33
|
149,965.16
|
|
2007
|
109,699.44
|
6,912.84
|
102,786.60
|
|
2006
|
84,153.69
|
22,639.79
|
61,513.90
|
|
2005
|
57,884.61
|
2,853.21
|
55,031.40
|
Source: The Statistics and Census Service ,http://www.dsec.gov.mo/
Source:
- The Ministry of Foreign Affairs of the People’s Republic of China
http://www.fmprc.gov.cn/chn/default.htm - The Ministry of Commerce of the People’s Republic of China
http://www.mofcom.gov.cn/ - The Economic and Commercial Consular’s office of the Embassy of the People’s Republic of China in the Federative Republic of Brazil
http://br.mofcom.gov.cn/index.shtml - Macao Statistics and Census Service
http://www.dsec.gov.mo/c_index.html - The World Factbook
http://www.cia.gov/ - World Economic Forum
http://www.wcforum.org/