Pesquisar
|
|
|
|
|
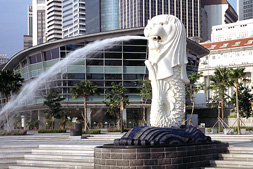
The Lion by the Sea
|
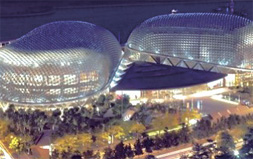
Esplanade – Theatres on the Bay
|
Orchard Central
|

OVERALL ECONOMIC SITUATION
Singapore is located on the southern tip of the Malay Peninsula; it is separated from Malaysia to the north by the Straits of Johor and neighbouring Indonesia across the Singapore Strait. The economy is driven by foreign trade, with electronics, petrochemical, finance, shipping and service industry as the mainstay of the country. Major trade partners include China, Japan, the United States and neighbouring markets. Foreign trade volume amounts to four times the GDP. The economy is growing at rapidly with an annual GDP growth of nine percent from 1960 to 1984. In 2001, under the influence of the global economic recession, Singapore’s economy experienced negative growth of two percent In order to stimulate economic development, the government introduced a programme aiming to build a new Singapore, steering the country towards a knowledge-based economy and setting up the Economy Restructuring Committee to review an economic development strategy and actively engage in free trade agreements with major economies around the world. In 2008, under the impact of the global economic meltdown, a number of industries were stricken, including finance, trade, manufacturing and tourism, the Strait Times index has reached the lowest in five years with an economic growth of 1.1percent. The Singaporean government took active measures and strengthened the monitoring of the financial markets, with an aim of safeguarding the stability of the financial market and enhance confidence of investors and reduce the rate of inflation. A new series of economic policies were put in place to stimulate the economy. In 2011, GDP growth reached 4.9 percent.
BUSINESS OPPORTUNITIES
Industries
Manufacturing and construction are the major industries. In 2010, the annual production volume amounted to SG$80.92 billion, equivalent to 26.7 percent of GDP. Products manufactured include electronics products, chemicals and chemical products, pharmaceutical, precision machinery, transportation equipment, petroleum products and oil refining. Singapore is the third largest oil refining centre in the world.
Service Industry
It covers retailing and wholesaling trade, hotels and tourism, transportation and telecommunications, financial as well as business services, which is the mainstay of economic growth. In 2010, the value of the industry amounted to SG$193.22 billion, equivalent to 63.6 percent of the GDP.
Tourism
Tourism is the major source of foreign exchange. Tourists mainly come from ASEAn countries, Australia, China, India and Japan. In 2011, it has received a total of 13.2 million incoming visitors (excluding Malaysian tourists taking the land route); hotel occupancy rate was 85.6percent. Main tourist attractions include the Sentosa, Singapore Zoo and the night Safari.
Source:http://www.yoursingapore.com/
|
MAIN ECONOMIC INDICATORS 2011
|
|
| Gross Domestic Product(US$ billion) | 314.2 |
| Real GDP growth (%) | 4.9 |
| GDP per capita(US$) | 59,900 |
| Inflation (%) | 5.2 |
| Land area (sq km) | 697 |
| Population (Million) | 4.7 |
Source:CIA-The World Factbook – Singapore, https://www.cia.gov/library/publications/the-world-factbook/geos/sn.html
FOREIGN TRADE FROM 2007 TO 2011
|
Year
|
Total Trade
|
Exports
|
Imports
|
| 2011 | $ 445.75 | $ 445.75 | $ 445.75 |
| 2010 | $ 661.6 | $ 661.6 | $ 661.6 |
| 2009 | $ 516.6 | $ 516.6 | $ 516.6 |
| 2008 | $ 562.2 | $ 562.2 | $ 562.2 |
| 2007 | $ 535.6 | $ 535.6 | $ 535.6 |
Major Export Commodities: machinery and equipment (electronics and telecommunications), pharmaceuticals and other chemical products,refined petroleum products
Main import Commodities: machinery and equipment, mineral fuels, chemical products, foodstuff, consumer goods
Source:
1.CIA-The World Factbook – Singapore,https://www.cia.gov/library/publications/the-world-factbook/geos/sn.html
2.Index Mundi-Country Fact, http://www.indexmundi.com/singapore/
| Main Destinations for Exports | % |
| Malaysia | 12.2 |
| US | 5.4 |
| China | 10.4 |
| Japan | 4.5 |
| Hong Kong China | 11 |
| Indonesia | 10.4 |
| Main Origin of Imports | % |
| Malaysia | 10.7 |
| US | 10.7 |
| China | 10.4 |
| Japan | 7.2 |
| South Korea | 5.9 |
| Taiwan China | 5.9 |
Source: https://www.cia.gov/library/publications/the-world-factbook/geos/sn.html
https://www.cia.gov/library/publications/the-world-factbook/geos/sn.html
MAINLAND CHINA – SINGAPORE
| Year | Total | Exports | Imports |
| 2012 (Jan-Mar ) | 148.01 | 81.02 | 66.99 |
| 2011 | 634.82 | 355.70 | 279.12 |
| 2010 | 570.58 | 323.48 | 247.10 |
| 2009 | 478.6 | 300.66 | 177.97 |
Source:Ministry of Commerce of the People’s Republic of China,http://yzs.mofcom.gov.cn/static/date/g/date.html/
MACAO-SINGAPORE BILAT ERAL TRADE 2011
| Type of Trade | Weight (KG) | Patacas |
| Imports | 166,157,381 | 1,356,940,325 |
| Exports | 206,629 | 61,857,072 |
Source:The Statistics and Census Service,http://www.dsec.gov.mo/
SOURCE:
1.The Ministry of Foreign Affairs of the People’s Republic of China
http://www.fmprc.gov.cn/chn/default.htm
2.The Ministry of Commerce of the People’s Republic of China
3. The Economic and Commercial Counselor’s Office of the Embassy of the
People’s Republic of China in Singapore
http://sg.mofcom.gov.cn/index.shtml
4. The Statistics and Census Service
http://www.dsec.gov.mo/]http://www.dsec.gov.mo/]http://www.dsec.gov.mo/
5.The World Factbook
http://www.cia.gov/]http://www.cia.gov/]http://www.cia.gov/
6. THE SINGAPORE GOVERNMENT’S OFFICIAL PORTAL