Pesquisar
ECONOMIC SITUATION
Located in the south-east of the Balkan Peninsula, Bulgaria borders Romania to the north, the Black Sea to the east, Turkey and Greece to the south, and Serbia and Macedonia to the west. After surviving a severe economic downturn in 1996, Bulgaria has achieved relative macroeconomic stability, a tolerable rate of inflation, low basic interest rates and substantial foreign exchange reserves with the service sector emerging as a major economic heavyweight in recent years. Bulgaria became a member state of the European Union on 1st January 2007.
 |
 |
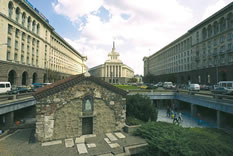 |
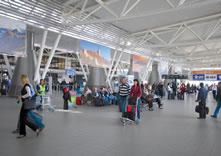
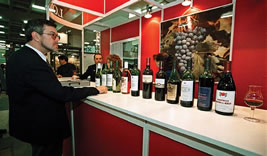
| Sofia Airport | A Wine Fair in Plodiv | A general view of downtown Sofia |
BUSINESS OPPORTUNITIES
Beverage Industry
Being endowed with the largest mineral water deposits in Europe, over 500 sources and boreholes in the country, mineral water has a major potential in the industry. At the same time, Bulgaria has been amongst the top 15 wine producing and exporting nations in the world taking up 2% of the world market share.
Logistics industry
As Bulgaria and Romania are now within the EU customs union, development of the logistics industry in Bulgaria has become more favourable. Local and international logistics operators, manufacturers, and trade companies continue to develop industrial facilities following the growing demand for quality warehouse and production space. At the same time, a major infrastructure investment programme is ongoing, which should mean sustainable improvement in the transport infrastructure of the region.
Energy Industry
The energy sector in Bulgaria has undergone major restructuring in recent years in order to be in line with the 2007 EU regulations. The network of natural gas pipelines running through the country has steadily increased, with reform and privatisation advanced by regional standards, all of which should enable Bulgaria to maintain its current role as south-Eastern Europe’s key exporter of power. Bulgaria has also been stimulating investment in renewable energy sources, alternative and bio-fuels, with hydro, solar and biomass; geothermal and wind energy showing the highest potential.
MAJOR WEBSITE RECOMMENDATION:
- INVEST BULGARIA AGENCY
http://investbg.government.bg/index.php
The mission of IBA is to help investors explore investment opportunities in Bulgaria and carry out greenfield investment projects in the country. You can find comprehensive information on Bulgaria’s up-to-date investment environment on their website. - NATIONAL STATISTICAL INSTITUTE OF REPUBLIC OF BULGARIA
http://www.nsi.bg
As the official statistical agency of the government, the National Statistical Institute of Republic of Bulgaria is in charge of the production and provision of quality statistical products. - MINISTRY OF ECONOMY AND ENERGY
http://www.mi.government.bg/eng/index.html
As the ministry is in charge of the development of the economic and energy policy and investment, innovations, exports and the use of renewable energy resources, the Ministry of Economy and Energy website provides up-to-date information and regulatory documents on trade, investment, industry and other related issues.
|
MAIN ECONOMIC INDICATORS 2007
|
|
| Gross Domestic Product (US$ Billions) | 86.73 |
| Real GDP growth (%) | 6.1 |
| GDP per capita (current US$) | 11,880 |
| Inflation (%) | 7.8 |
| Land area (ten thousand sq km) | 11 |
| Population (Million) | 7.3 |
Source: CIA-The World Fact Book – Bulgaria https://www.cia.gov/library/publications/the-world-factbook/geos/bu.html
|
FOREIGN TRADE FROM 2002 TO 2006 ( Unit: Million EUR)
|
|||
|
Year
|
Total Trade
|
Exports
|
Imports
|
|
2006
|
30491.2
|
12011.9
|
18479.3
|
|
2005
|
24134
|
9466.3
|
14667.7
|
|
2004
|
19604.4
|
7984.9
|
11619.5
|
|
2003
|
16278.7
|
6668.2
|
9610.5
|
|
2002
|
14474.1
|
6062.9
|
8411.2
|
Source: National Statistical Institute of Republic of Bulgaria-www.nsi.bg, World Economic Factbook 2007
Main Exports – commodities: clothing, footwear, iron and steel, machinery and equipment, fuels
Main Imports – commodities: machinery and equipment, metals and ores, chemicals and plastics, fuels, minerals, and raw materials
|
Main Origins of Imports (2006)
|
%
|
Main Destinations of Exports (2006)
|
%
|
|
Germany
|
15
|
Turkey
|
12
|
|
Italy
|
10.6
|
Italy
|
10.4
|
|
Turkey
|
7.2
|
Germany
|
10
|
|
Greece
|
6.3
|
Greece
|
8.2
|
|
MAINLAND CHINA – BULGARIA BILATERAL TRADE (Unit: Million EUR)
|
|||
|
Year
|
Total
|
Exports
|
Imports
|
|
2006
|
832.7
|
770.4
|
62.3
|
|
2005
|
624.8
|
567.4
|
57.4
|
|
2004
|
406.9
|
377.1
|
29.7
|
|
2003
|
303.1
|
248.6
|
54.5
|
|
2002
|
159.2
|
145.8
|
13.4
|
|
MACAO – THE CZECH REPUBLIC BILATERAL TRADE – MAIN CATEGORIES AND PRODUCTS IN 2007
|
||
|
Category
|
Weight (KG)
|
MOP
|
|
Imports
|
4,535
|
1,752,655
|
Note 1 : Exports = Domestic Exports + Re-exports
Note 2 : From May 2000, data on Transit is only available up to the 4th digit of NCEM/HS
SOURCE:
- The Ministry of Foreign Affairs of the People’s Republic of China
http://www.fmprc.gov.cn/chn/ - The Ministry of Commerce of the People’s Republic of China
http://www.mofcom.gov.cn/ - The Embassy of the People’s Republic of China in the Republic of Bulgaria
http://www.chinaembassy.bg/chn/ - The Economic and Commercial Counsellor’s office of the Embassy of the People’s Republic of China in the Republic of Bulgaria
http://big5.mofcom.gov.cn/gate/big5/bg2.mofcom.gov.cn/index.shtml - Invest Bulgaria Agency
http://investbg.government.bg/ - Macao Statistics and Census Service
http://www.dsec.gov.mo/c_index.html - Macao Economic Services
http://www.economia.gov.mo/ - Macao Trade and Investment Promotion Institute
http://www.ipim.gov.mo/pt-pt/ - The World Factbook
http://www.cia.gov - World Economic Factbook 2006/2007
- Bulgaria Chamber of Commerce and Industry
http://www.bcci.bg/ - National Statistical Institute of Republic of Bulgaria
http://www.nsi.bg
SOURCE:
- European Commission
http://ec.europa.eu/enlargement/archives/bulgaria/pictures_en.htm - Sofia-Airport
http://www.sofia-airport.bg/