Equatorial Guinea
|
National Flag |
 |
|
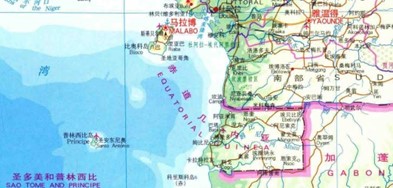
Map |
 |
|
Basic Information |
Equatorial Guinea is located in the heart of Gulf of Guinea, in west-central Africa, bordered by the Atlantic Ocean to the west, the Cameroon to the north and the Gabon to the east and south. It has a land area of approximately 28.1 thousands square kilometers and the population is about 1.5 million in 2021. The capital is Malabo and Bata city is the largest economic centre of the country. |
|
Investment Situation |
Equatorial Guinea has petroleum, natural gas, phosphate, gold, bauxite, zinc, diamond and other resources, with natural gas and proven crude oil reserves of 300 billion cubic meters and 5.6 barrels respectively. Equatorial Guinea is the third largest oil producer in sub-Saharan Africa and crude oil has become a pillar industry of country’s economic and social development. In 2021, the daily production capacity of crude oil was around 100 thousand barrels, mainly explored by USA and UK companies. Rich in forest and fishery resources, the forest area is 2.2 million hectares with 46% forest coverage rate and the maritime exclusive economic zone is 312 thousands square kilometers. Tuna, African yellow croaker and prawns are rich, with an annual catch of 70,000 to 100,000 tons. The “2022 World Investment Report” published by the United Nations Conference on Trade and Development (UNCTAD), pointed out that by the end of 2021, Equatorial Guinea has attracted US$15.6 billion on stock of inward direct investment. According to the “2021 Statistical Bulletin of China’s Outward Foreign Direct Investment”, by the end of 2021, the stock of direct investment of China in Equatorial Guinea was US$280 million. |
|
Trade in Goods |
In 2021, Equatorial Guinea’s main export destinations are China, India, Spain and Korea. Its main export goods are mainly crude oil, organic chemicals, and wooden products. The main import origins include Spain, China, the United States, and the United Kingdom. The main imported goods include vessels, machines, and beverages. In 2022, China’s exports to Equatorial Guinea amounted to US$230 million, mainly include non-navigating vessels, liquefied gas carrier, ground tile; goods imported from Equatorial Guinea amounted to US$1.5 billion, mainly include crude oil, liquefied natural gas. |
Economic Indicators
|
2020(a) |
2021(a) |
2022(b) |
2023(b) |
|
|
Population (million) |
1.4 |
1.5 |
1.5 |
1.5 |
|
GDP (US$ million) |
10,099 |
12,269 |
16,877 |
15,576 |
|
Real GDP Growth Rate (%) |
-4.2 |
-3.2 |
5.8 |
-3.1 |
|
Total Export of Goods (US$ million) |
2,825.0 |
4,693.9 |
4,291.6 |
3,331.7 |
|
Total Import of Goods (US$ million) |
887.0 |
814.5 |
635.0 |
563.9 |
|
Total Export of Services (US$ million) |
529(c) |
554(c) |
– |
– |
|
Total Import of Services (US$ million) |
1,262(c) |
1,812(c) |
– |
– |
|
Consumer Price Index (%) |
4.8 |
-0.1 |
5.1 |
5.7 |
|
Current Account Balance (US$ million) |
-419 |
-420 |
-269 |
-327 |
|
Exchange Rate (Central African Franc CFA: USD, Period Average) |
575.6 |
554.5 |
623.8 |
662.6 |
Remarks: (a) actual value; (b) estimated value of International Monetary Fund (IMF); (c) estimated value of UNCTAD, WTO and ITC
Source: International Monetary Fund (IMF), International Trade Center (ITC)
Main Export and Import Place of Goods
|
Main Export Destinations (2021) |
Proportion of Total Value of Exports Goods (%) |
|
China |
24.1 |
|
India |
17.1 |
|
Spain |
16.0 |
|
Korea |
7.3 |
|
Others |
35.5 |
|
Main Import Origins (2021) |
Proportion of Total Value of Imports Goods (%) |
|
Spain |
24.7 |
|
China |
15.9 |
|
United States |
6.6 |
|
United Kingdom |
5.6 |
|
Others |
47.2 |
Source: International Monetary Fund (IMF)
Major Imports and Exports of Goods
|
Major Exports of Goods (2021) |
Proportion of Total Value of Exports of Goods (%) |
|
Fossil fuels, mineral oil and its distilled products; bituminous substances; mineral wax |
89.9 |
|
Organic chemicals |
7.5 |
|
Wood and articles of wood; wood charcoal |
2.0 |
|
Others |
0.6 |
|
Major Imports of Goods (2021) |
Proportion of Total Value of Imports of Goods (%) |
|
Vessels and other floating structures for breaking up |
23.6 |
|
Nuclear reactors, boilers, machinery and mechanical appliances; parts thereof |
11.2 |
|
Beverages, spirits and vinegar |
7.0 |
|
Meat and edible meat offal |
5.9 |
|
Others |
52.3 |
Source: International Trade Center (ITC)
Major Imports and Exports of Services
|
Main Exports of Services (2021) |
Proportion of Total Value Exports of Services (%) |
|
Transport |
6.6 |
|
Government goods and services n.i.e. |
6.2 |
|
Telecommunication, computer and information services |
1.2 |
|
Other |
86.0 |
|
Main Import of Services (2021) |
Proportion of Total Value Imports of Services (%) |
|
Transport |
52.6 |
|
Construction |
11.2 |
|
Insurance and pension services |
10.6 |
|
Other |
25.6 |
Remarks:The above content is based on estimated value of UNCTAD, WTO and ITC.
Source:International Trade Centre (ITC)
Statistics on the Trade of Goods between Mainland China and Equatorial Guinea (US$ ten thousands)
|
Year |
Total Trade |
Total Exports value* |
Total Imports value** |
|
2022 |
1,747,111 |
230,727 |
1,516,384 |
|
2021 |
1,336,938 |
123,993 |
1,212,945 |
|
2020 |
1,276,382 |
122,097 |
1,154,284 |
|
2019 |
1,836,279 |
113,215 |
1,723,064 |
|
2018 |
2,290,408 |
145,146 |
2,145,261 |
Remarks: *Value of goods exported to Equatorial Guinea from Mainland China; **Value of goods imported from Equatorial Guinea to Mainland China
Source: General Administration of Customs of the People’s Republic of China
Source of Data:
- Ministry of Foreign Affairs of the People’s Republic of China
- “Country (region) guide for foreign investment co-operation (Equatorial Guinea)” by the Ministry of Commerce the People’s Republic of China
- “2021 Statistical Bulletin of China’s Outward Foreign Direct Investment” by the Ministry of Commerce of the People’s Republic of China, National Bureau of Statistics and State Administration of Foreign Exchange
- General Administration of Customs of the People’s Republic of China
- SinoMaps Press
- International Monetary Fund (IMF)
- International Trade Center (ITC)
- “2022 World Investment Report” by the United Nations Conference on Trade and Development (UNCTAD)
- “Country Economic Forecast – Equatorial Guinea (Nov 2022)” by Oxford Economics
Updated in March 2023.


