East Timor
|
National Flag |
|
|
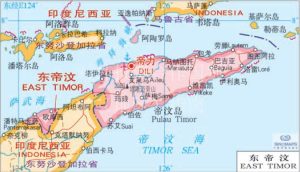
Map |
|
|
Basic Info |
Timor-Leste is located at the easternmost tip of the Nusa Tenggara Islands in Southeast Asia, with West Timor of Indonesia to its west, and across the Timor Sea to Australia in the south. It has a land area of about 15 thousands square kilometres and a population of about 1.4 million by the end of 2021. The capital, Dili, is located on the northeast coast of the island of Timor. It is a deep-water port and the national political, economic and cultural centre. |
|
Investment Situation |
Timor-Leste is readily waiting for revitalization with relatively slow development over the years. However with the gradual implementation of the national medium- and long-term strategic development plan and a large oil reserve, it will continuously bring about the needs of construction projects in the future, bringing more investments from various types of funds namely private entities, international organizations and other countries. Timor–Leste might embrace a period of rapid development. At the same time, many countries have implemented tariff-free treatment for most of products originated from Timor-Leste, which has created good opportunities for enterprises and individuals to develop foreign trade, investment and businesses. Timor-Leste is an agricultural country, more than 80% of active population are engaged in agricultural activities, but agriculture is still underdeveloped and food is not self-sufficient. Main agricultural products include corn, grain, potato, etc, cash crops include coffee, rubber, coconut, etc. About 10% of the workforce is engaged in industrial production, including textiles, drinking water bottling and coffee processing. The service industry is another important economic component, which is highly concentrated in the capital Dili. Due to the influx of foreign capital, service industries like trade, catering and hotels have achieved rapid development. According to the “2022 World Investment Report” published by the United Nations Conference on Trade and Development (UNCTAD), by the end of 2021, Timor-Leste has attracted US$550 million on stock of inward direct investment. According to statistics from the Ministry of Commerce of China, by the end of 2021, the stock of direct investment of China in Timor-Leste was US$100 million. The main areas of investment were restaurants, hotels, department stores, construction materials and service industry. |
|
Trade in Goods |
In 2021, Timor-Leste’s main export destinations are Indonesia, China, Switzerland and Japan. The main export goods are petroleum and coffee. The main origins for imports are Indonesia, China, Singapore, Hong Kong (China), and the main imported goods are refined oil, automobile, machinery and accessories. In 2022, China’s exports to Timor-Leste amounted to US$290 million, mainly include welded pipe, container forklift and loading ramp, and polished rice. Goods imported from Timor-Leste amounted to US$150 million, mainly include crude oil and coffee. |

Economic Indicators
|
2020(a) |
2021(a) |
2022b) |
2023(b) |
||
|
Population (million) |
1.3 |
1.3 |
1.4 |
1.4 |
|
|
GDP (US$ million) |
1,902 |
2,358 |
2,455 |
2,085 |
|
|
Real GDP Growth Rate (%) |
-8.6 |
1.5 |
3.3 |
4.2 |
|
|
Total Export of Goods (US$ million) |
17.4 |
2,287.3 |
35.0 |
39.0 |
|
|
Total Import of Goods (US$ million) |
527.3 |
799.7 |
682.0 |
765.0 |
|
|
Total Export of Services (US$ million) |
39.7 |
28.1 |
– |
– |
|
|
Total Import of Services (US$ million) |
315.1 |
722.8 |
– |
– |
|
|
Consumer Price Index (%) |
0.5 |
3.8 |
7.0 |
4.0 |
|
|
Current Account Balance (US$ million) |
-308 |
-43 |
-284 |
-821 |
|
|
Exchange Rate |
US dollar is used; also issued Centavo the nation coin, with 1:1 with US dollar |
||||
Remarks: (a) actual value; (b) estimated value of International Monetary Fund (IMF)
Source: International Monetary Fund (IMF)
Main Export and Import Place of Goods
|
Main Export Destinations (2021) |
Proportion of Total Value of Exports of Goods (%) |
|
Indonesia |
73.4 |
|
China |
11.9 |
|
Switzerland |
8.8 |
|
Japan |
2.9 |
|
Others |
3.0 |
|
Main Import Origins (2021) |
Proportion of Total Value of Imports of Goods (%) |
|
Indonesia |
39.2 |
|
China |
16.3 |
|
Singapore |
13.8 |
|
Hong Kong (China) |
5.6 |
|
Others |
25.1 |
Source: International Monetary Fund (IMF)
Major Imports and Exports of Goods
|
Major Exports of Goods (2021) |
Proportion of Total Value of Exports of Goods (%) |
|
Mineral fuels, mineral oils and products of their distillation; bituminous substances; mineral waxes |
91.3 |
|
Coffee, tea, mate and spices |
5.1 |
|
Electrical machinery and equipment and parts thereof; sound recorders and reproducers, television image and sound recorders and reproducers, and parts and accessories of such articles |
0.8 |
|
Others |
2.8 |
|
Major Imports of Goods (2021) |
Proportion of Total Value of Imports of Goods (%) |
|
Mineral fuels, mineral oils and products of their distillation; bituminous substances; mineral waxes |
18.1 |
|
Vehicles other than railway or tramway rolling-stock and parts and accessories thereof |
7.6 |
|
Steel product |
7.4 |
|
Others |
66.9 |
Source: International Trade Center (ITC)
Major Imports and Exports of Services
|
Main Exports of Services (2021) |
Proportion of Total Value Exports of Services (%) |
|
Tourism |
42.9 |
|
Government goods and services n.i.e. |
39.3 |
|
Financial Services |
14.3 |
|
Other |
3.5 |
|
Main Imports of Services (2021) |
Proportion of Total Value Imports of Services (%) |
|
Government goods and services n.i.e. |
41.2 |
|
Construction |
24.0 |
|
Transport |
15.6 |
|
Other |
19.2 |
Remarks:The above content is based on estimated value of UNCTAD, WTO and ITC.
Source:International Trade Centre (ITC)
Statistics on the Trade of Goods between Mainland China and Timor-Leste (US$ ten thousands)
|
Year |
Total Trade |
Total Exports Value* |
Total Imports Value** |
|
2022 |
43,584.0 |
29,048.3 |
14,535.7 |
|
2021 |
37,358.5 |
26,043.3 |
11,345.1 |
|
2020 |
19,162.7 |
19,041.7 |
121.1 |
|
2019 |
16,751.0 |
14,294.6 |
2,456.4 |
|
2018 |
13,550.3 |
13,248.9 |
301.4 |
Remarks: *Value of goods exported to Timor-Leste from Mainland China; **Value of goods imported from Timor-Leste to Mainland China
Source of Data: General Administration of Customs of the People’s Republic of China
Statistics on the Trade of Goods between the Macao SAR and Timor-Leste (US$) (USD 1 » MOP 8)
|
Year |
Total trade |
Total exports value* |
Total imports value ** |
|
2022 |
746.8 |
746.8 |
– |
|
2021 |
– |
– |
– |
|
2020 |
219,383.9 |
– |
219,383.9 |
|
2019 |
– |
– |
– |
|
2018 |
20,356.5 |
20,356.5 |
– |
Remarks: *Value of goods exported to Timor-Leste from Macao; **Value of goods imported from Timor-Leste to Macao.
Source: Statistics and Census Service (DSEC), Macao SAR Government
Source:
- “Country (region) guide for foreign investment co-operation (Timor-Leste)” by the Ministry of Commerce the People’s Republic of China
- “2021 Statistical Bulletin of China’s Outward Foreign Direct Investment” by the Ministry of Commerce of the People’s Republic of China, National Bureau of Statistics and State Administration of Foreign Exchange
- General Administration of Customs of the People’s Republic of China
- SinoMaps Press
- Statistics and Census Service (DSEC), Macao SAR Government
- Statistics Timor-Leste
- International Monetary Fund (IMF)
- International Trade Center (ITC)
- “2022 World Investment Report” by the United Nations Conference on Trade and Development (UNCTAD)
- “Country Economic Forecast – Timor-Leste (Nov 2022)” by Oxford Economics
Updated in March 2023.


